Recovery calculation: how to quantify avoided CO₂e and energy
A recovery calculation measures how much greenhouse gas and primary energy is avoided compared with the scenario in which a waste stream is not recovered. The formula, the four inputs and a worked 100-tonne PET example.
By clca Editorial TeamLast updated
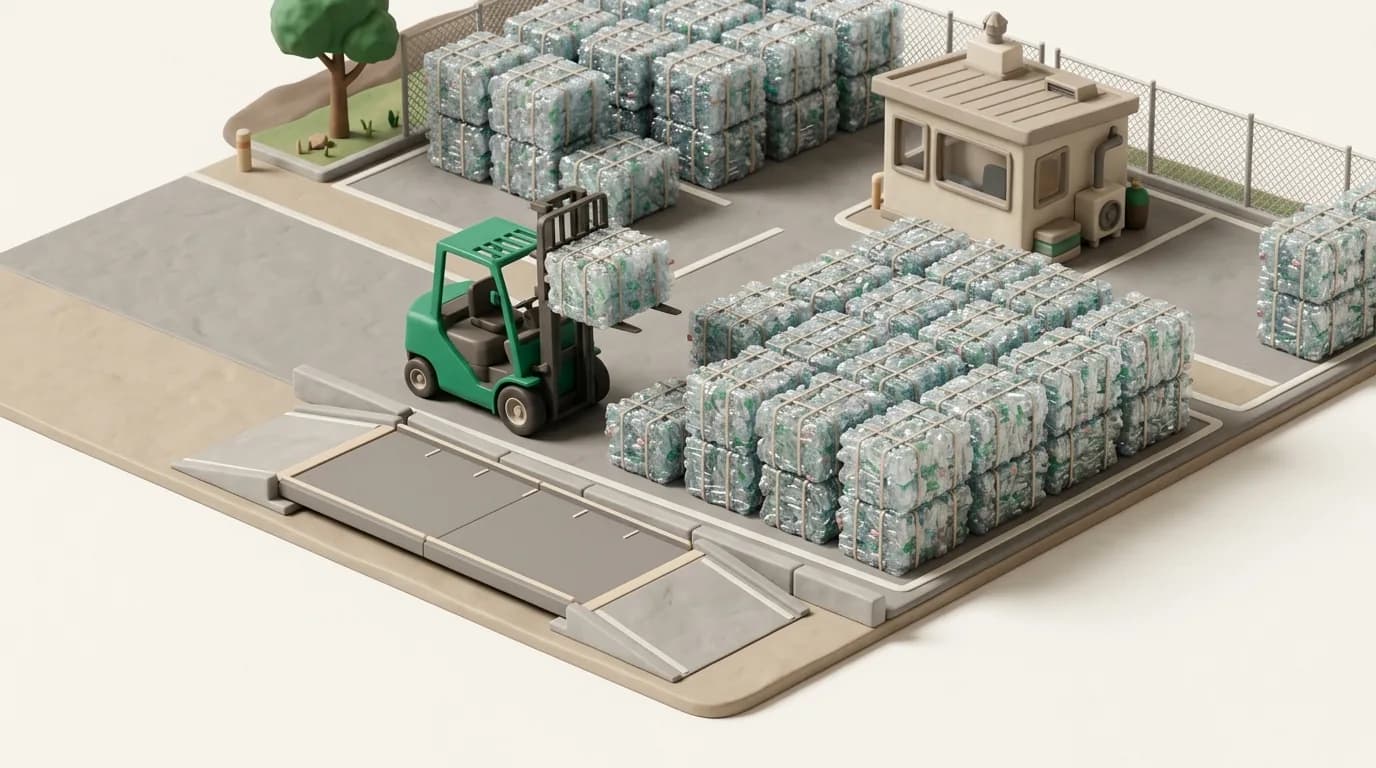
A recovery calculation is the method that quantifies the greenhouse gas emissions and primary energy consumption avoided when a collected waste stream goes to recycling. The result is a credit that does not enter the waste producer's own inventory but can be declared: every kilogram recovered avoids producing the same product from virgin raw material. The heart of the calculation is a counterfactual comparison — the question “what would have happened had this material not been recovered?” is answered with a background database such as ecoinvent. This article explains the formula, its four inputs and the indicators step by step, closing with a worked 100-tonne PET example and the most common mistakes.
The counterfactual logic: what is the credit a difference of?
A recovery credit is the difference between two routes: the primary production that is displaced and the secondary production that actually takes place. The primary route is manufacturing the functionally equivalent product from virgin raw material — granulate from petroleum-derived monomers for PET, converter steel from ore for steel. The secondary route is sorting and processing the collected waste into the same product. Recovery is never free: sorting, washing, grinding, remelting and transport carry their own burden. The credit is the gap between the primary burden avoided and the recovery burden incurred; if that gap closes, or even reverses, the credit drops to zero or turns negative.
This logic is related to Module D in EN 15804+A2 but is not the same thing. Module D reports the potential benefit a product will deliver at its end of life, inside the product EPD. A recovery balance instead calculates, from the perspective of the organisation that generated the waste, the benefit of the tonnage actually collected and sent to recovery in a given period. The point of view is the site or the company rather than the product, and the time frame is last year rather than a hypothetical end of life.
The formula: dry mass × yield × substitution × factor gap

The avoided impact per stream comes from a single product: credit = dry mass × yield × substitution ratio × (primary factor − secondary factor). The formula is identical for GWP and for primary energy; only the unit of the factors changes — kg CO₂e per kg of product in the first case, MJ per kg of product in the second. Each of the four inputs embeds a separate judgement, and the quality of the calculation is capped by its weakest input. The order of multiplication does not matter, but which mass a factor is applied to does: factors are defined per kilogram of secondary product, not per kilogram of waste. Yield is the bridge that converts waste mass into product mass.
- Dry mass — net material after moisture and contamination are deducted from the collected tonnage; a weighbridge ticket gives wet mass, the formula wants dry mass
- Yield — how many kg of secondary product come out of 1 kg of collected waste; catalogue values such as 0.823 for PET or 0.991 for aluminium scrap
- Substitution ratio — how many kg of primary product 1 kg of secondary product replaces; 1.0 when quality is equivalent, below 1 when quality drops (downcycling)
- Primary factor — the cradle-to-gate impact of the displaced virgin product; in ecoinvent a market activity such as “PET granulate, bottle grade | GLO”
- Secondary factor — the impact of the recovery route; an activity such as “PET granulate, bottle grade, recycled | GLO” covering sorting, washing and extrusion
The four inputs one by one
Dry mass and the moisture correction
Waste data almost always arrives as wet mass: the weighbridge weighs the whole container. Paper and board can carry 8–15 per cent moisture, organic waste 60–80 per cent; plastics and metals are drier but carry contaminants such as labels, caps and residue. If a factor is applied without deducting moisture and contamination, the credit is systematically inflated. The practical route is to record a moisture percentage per stream and build the calculation on dry mass; where no record exists, a conservative assumption (higher moisture) is chosen and written into the report.
Yield: from waste to product
Yield reflects the loss rate of the recovery process. On the input side of a secondary product activity in ecoinvent there is a figure for how many kg of waste input are required: for PET, 1 kg of recycled granulate requires 1.215 kg of sorted waste PET, so the yield is 1/1.215 = 0.823. The ratio varies widely by material — melt loss is small for aluminium (0.991), while post-consumer wood sits around 0.80 on a dry-mass basis. Yield cannot exceed 1; a value above 1 signals either a missing moisture correction or a mix-up of mass units.
Substitution ratio: the quality question
The substitution ratio states what the secondary product actually replaces on the market. For bottle-to-bottle PET or scrap remelted into the same aluminium alloy, 1.0 is defensible. If garden furniture made from mixed plastics replaces timber, the correct primary factor is timber rather than virgin plastic, and the ratio is debatable. Where quality drops (downcycling) the ratio falls below 1; a value above 1 is accepted only with a documented justification — for instance the secondary product delivering the same function with less material. Uncertainty concentrates in this input more than any other, and sensitivity analysis should start here.
Factors: which activity, which geography
Primary and secondary factors are drawn from ecoinvent, and the two activities must genuinely correspond: same product, same unit, comparable quality grade. Geography is the second decision — a GLO or RER market activity if the primary product comes from the global market, the dataset closest to the region if the secondary product is made locally. In electricity-intensive routes (EAF steel, aluminium remelting) the grid factor changes the result markedly, and the secondary factor has to be corrected to the destination country's grid. The cut-off system model is the preferred choice: secondary material enters free of historical burden, so the credit is not counted twice.
Indicators: GWP100 and non-renewable primary energy
Two headline indicators are enough for a recovery balance, and both definitions must be fixed. For climate, IPCC 2021 GWP100 in the variant excluding biogenic CO₂ is used, so that the biogenic carbon taken from the forest and returned with the waste does not masquerade as a credit in paper and wood. For energy, cumulative energy demand (CED) in its non-renewable, higher-heating-value form is chosen. Total CED should not serve as the headline figure: the biomass energy embodied in wood enters total CED and makes the energy saving of wood recovery look several times larger than it is. The energy headline in the report is always non-renewable CED, and a footnote explains the choice.
Worked example: 100 tonnes of PET
A site sends 100 tonnes of sorted PET bottles a year to a licensed recycler. Dry mass is 100,000 kg (after removing labels and caps), yield 0.823, substitution 1.0 (bottle-to-bottle quality). The gap between the ecoinvent 3.12 cut-off based primary and secondary factors varies with site and grid, but for PET it sits in a range of roughly 1.8–2.4 kg CO₂e per kg of granulate; take 2.0 as the midpoint. Credit = 100,000 × 0.823 × 1.0 × 2.0 = 164,600 kg, about 165 t CO₂e (148–198 t across the range). For energy, with a factor gap of roughly 50 MJ/kg: 100,000 × 0.823 × 50 = 4,115,000 MJ ≈ 4,100 GJ ≈ 1,140 MWh of non-renewable primary energy. The report states both figures with their range and the activity references.
The lesson of the example lies less in the size of the result than in where its sensitivity sits: a 20 per cent swing in the factor gap moves the credit by 20 per cent; taking yield as 0.75 instead of 0.823 cuts it by 9 per cent; pulling substitution down to 0.8 cuts it by 20 per cent. The pessimistic end of all three inputs together halves the credit. That is why a base scenario plus a range is reported rather than a single figure.
Common mistakes
- Applying a factor to wet mass — inflates the credit by 10–70 per cent in paper and organic streams
- Applying the primary factor to the kilogram of waste — skips yield and ignores process loss
- Granting the same stream both a material and an energy recovery credit — double counting
- Making total CED the headline — biomass energy in paper and wood looks like a saving
- Using GLO for the primary activity and a local grid for the secondary without correcting the electricity gap
- Confusing a credit with a reduction — avoided emissions cannot be deducted from the organisation's own inventory
Frequently asked questions
- What is a recovery calculation, in short?
- It is the calculation of the greenhouse gas and primary energy avoided when a collected waste stream goes to recycling. The credit is the difference between the burden of the displaced virgin production and the burden of the recovery process, computed per stream from dry mass, yield, substitution ratio and ecoinvent factors.
- Are avoided emissions the same as reduced emissions?
- No. A reduction is a decrease in the organisation's own Scope 1-2-3 inventory. Avoided emissions are a benefit arising outside the system boundary, from another manufacturer not using virgin raw material; they cannot be deducted from the inventory, are not an offset, and are reported as a separate balance.
- Which ecoinvent system model should be used for a recovery credit?
- The cut-off model. In it, secondary material input carries no burden from its previous life cycle, so the difference between primary and secondary activities yields a clean credit. APOS or consequential models allocate the same benefit elsewhere and cannot be read as a primary–secondary gap.
- What is the difference between yield and substitution ratio?
- Yield states how many kg of secondary product come out of 1 kg of waste and reflects process loss (0.823 for PET). The substitution ratio states how many kg of primary product 1 kg of secondary product replaces and reflects quality: 1.0 when equivalent, lower when downcycling occurs.
- Why is the energy saving reported with non-renewable CED rather than total CED?
- Total CED also counts the combustion energy embodied in biomass-derived materials such as wood and paper, and that energy is not a fossil resource saving. Non-renewable CED covers only fossil and nuclear primary energy and shows the resource that recovery genuinely avoids.
Tags
- recovery
- recycling credit
- recovery calculation
- avoided emissions
- waste management
- circular economy
- ecoinvent
Related reading
All articles in Data & Methods- Data & Methods
Recovery credits by material: from PET to aluminium
A tonne of recovered aluminium and a tonne of paper do not earn the same credit. The primary and secondary route, the order of magnitude of the credit and the specific trap for each of six materials.
12 min read - Data & Methods
Recovery yield and substitution ratio: product per kg of waste
The two quiet multipliers of a recovery credit: yield, which describes process loss, and the substitution ratio, which describes quality. Catalogue yields by material, the moisture correction and downcycling.
10 min read - Data & Methods
Recovery of organic waste: compost, biogas and open dumping
Organic waste substitutes no product; the credit comes entirely from avoided methane. Open dumping, landfill, composting and biogas compared on ecoinvent 3.12 data.
12 min read - Data & Methods
Energy recovery or material recycling? Comparing the credits
The same tonne of plastic displaces electricity if burned and granulate if recycled — but the two credits are not the same size and cannot both be granted to one stream. The waste hierarchy, EN 15804 Table 13 and the formulae.
11 min read