Every module in one gallery.
Detailed screenshots from every module of the C-LCA platform. Walk through the full flow from dashboard to EPD report visually. Click any image to enlarge and navigate.
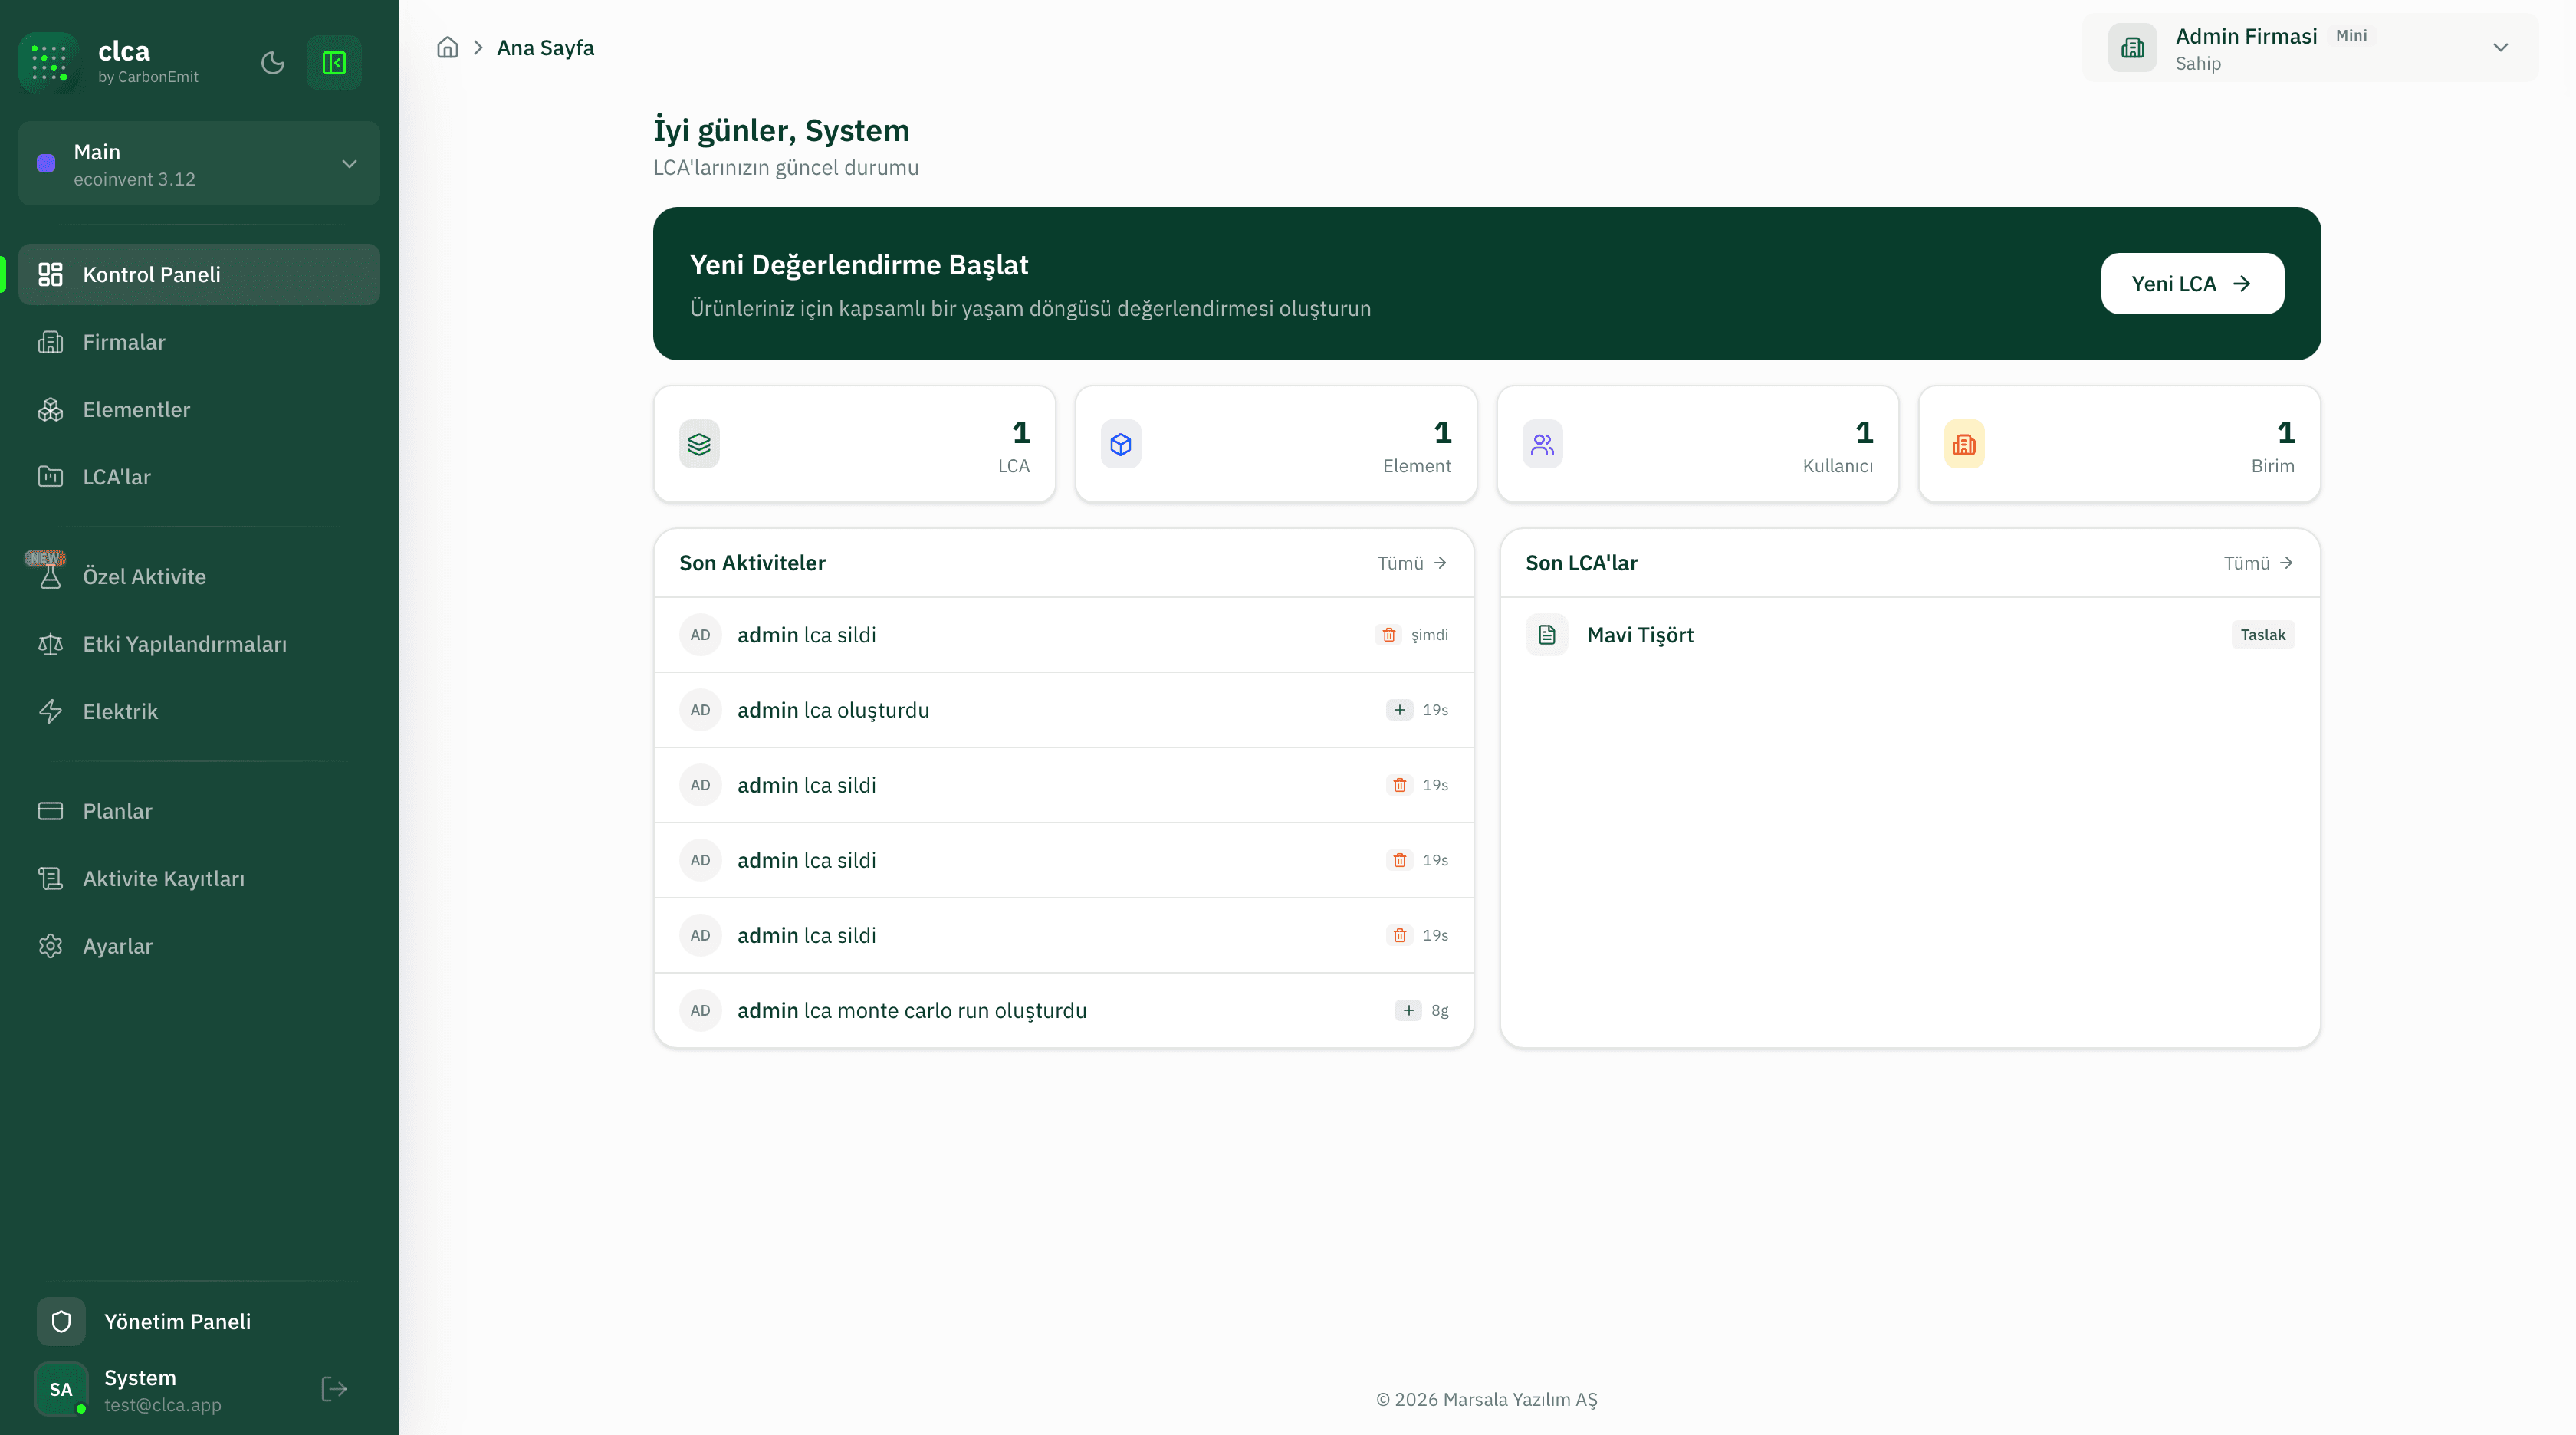
clca Dashboard — LCA, Element and User Overview
clca's main control panel surfaces the company's LCA studies, element and user counts and units at a glance. The 'Start New Assessment' card jumps straight into the flow, while the right panel lists recent LCAs with status badges (Draft/Published).
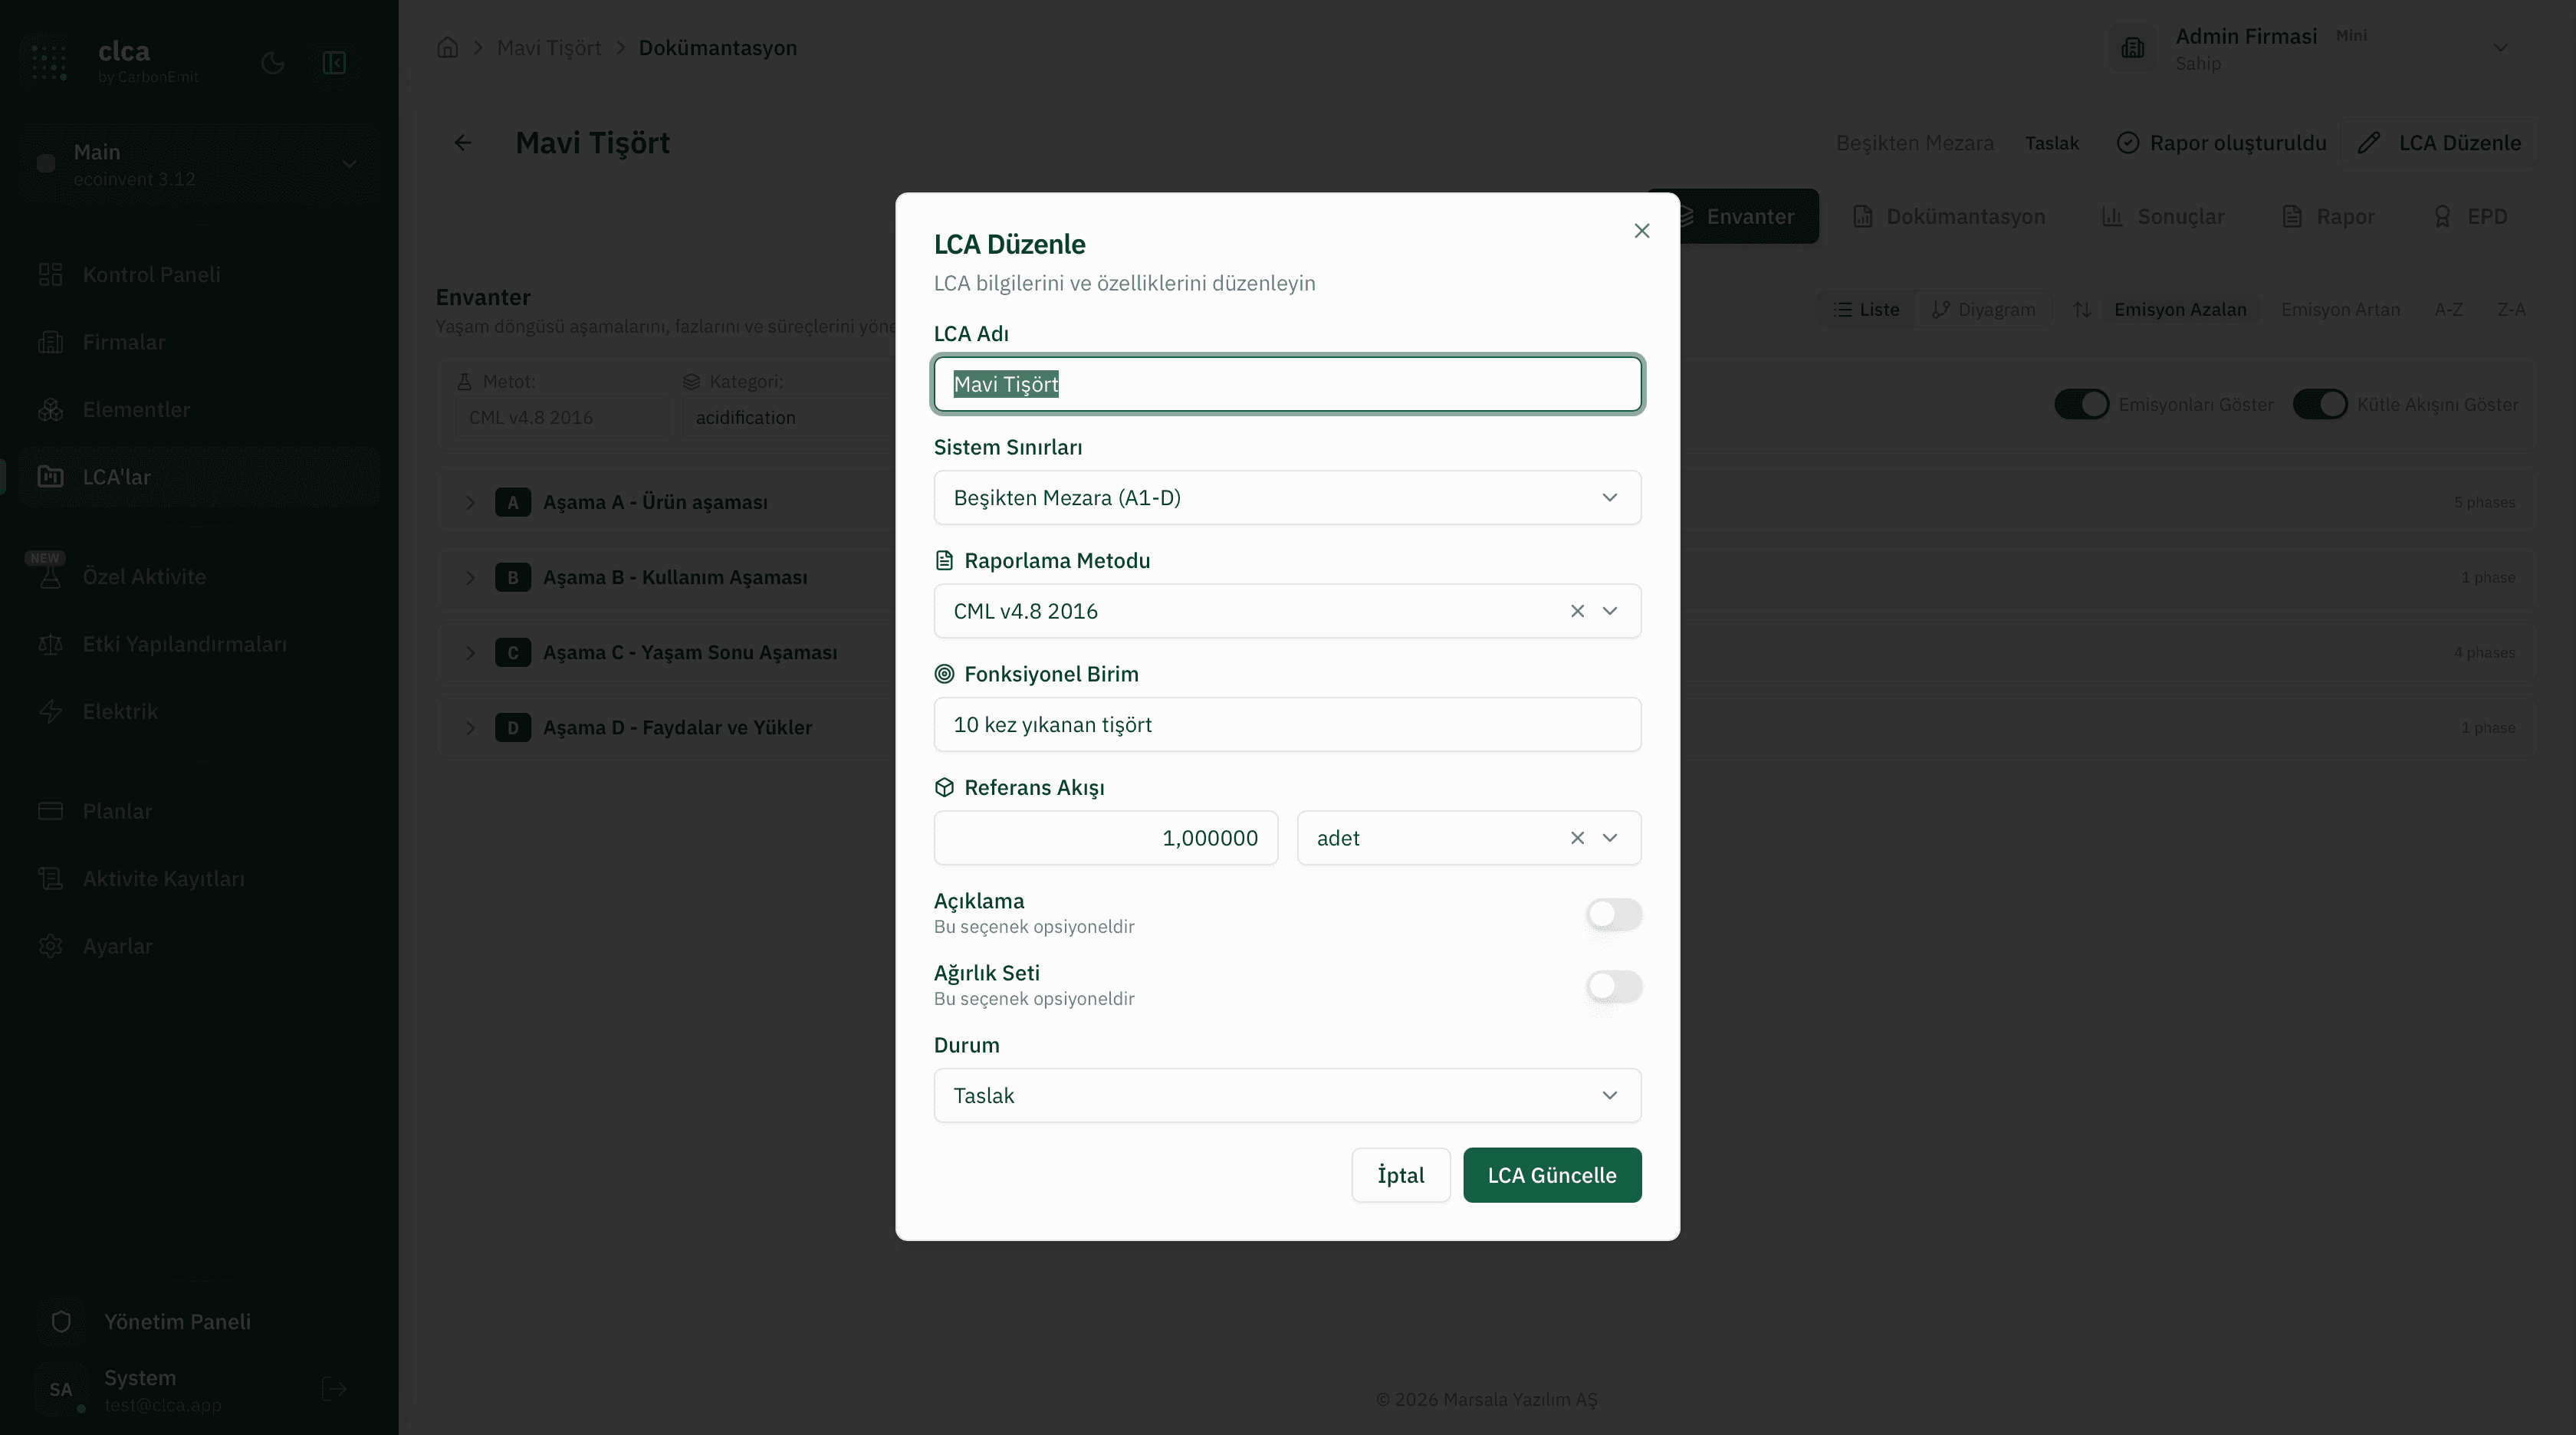
LCA Setup — System Boundaries, Methodology and Functional Unit
The LCA setup screen defines the study's core parameters — system boundary (Cradle to Grave A1-D), reporting method (CML v4.8 2016), functional unit, reference flow and status — in a single modal. Weighting set and description are optional toggles.
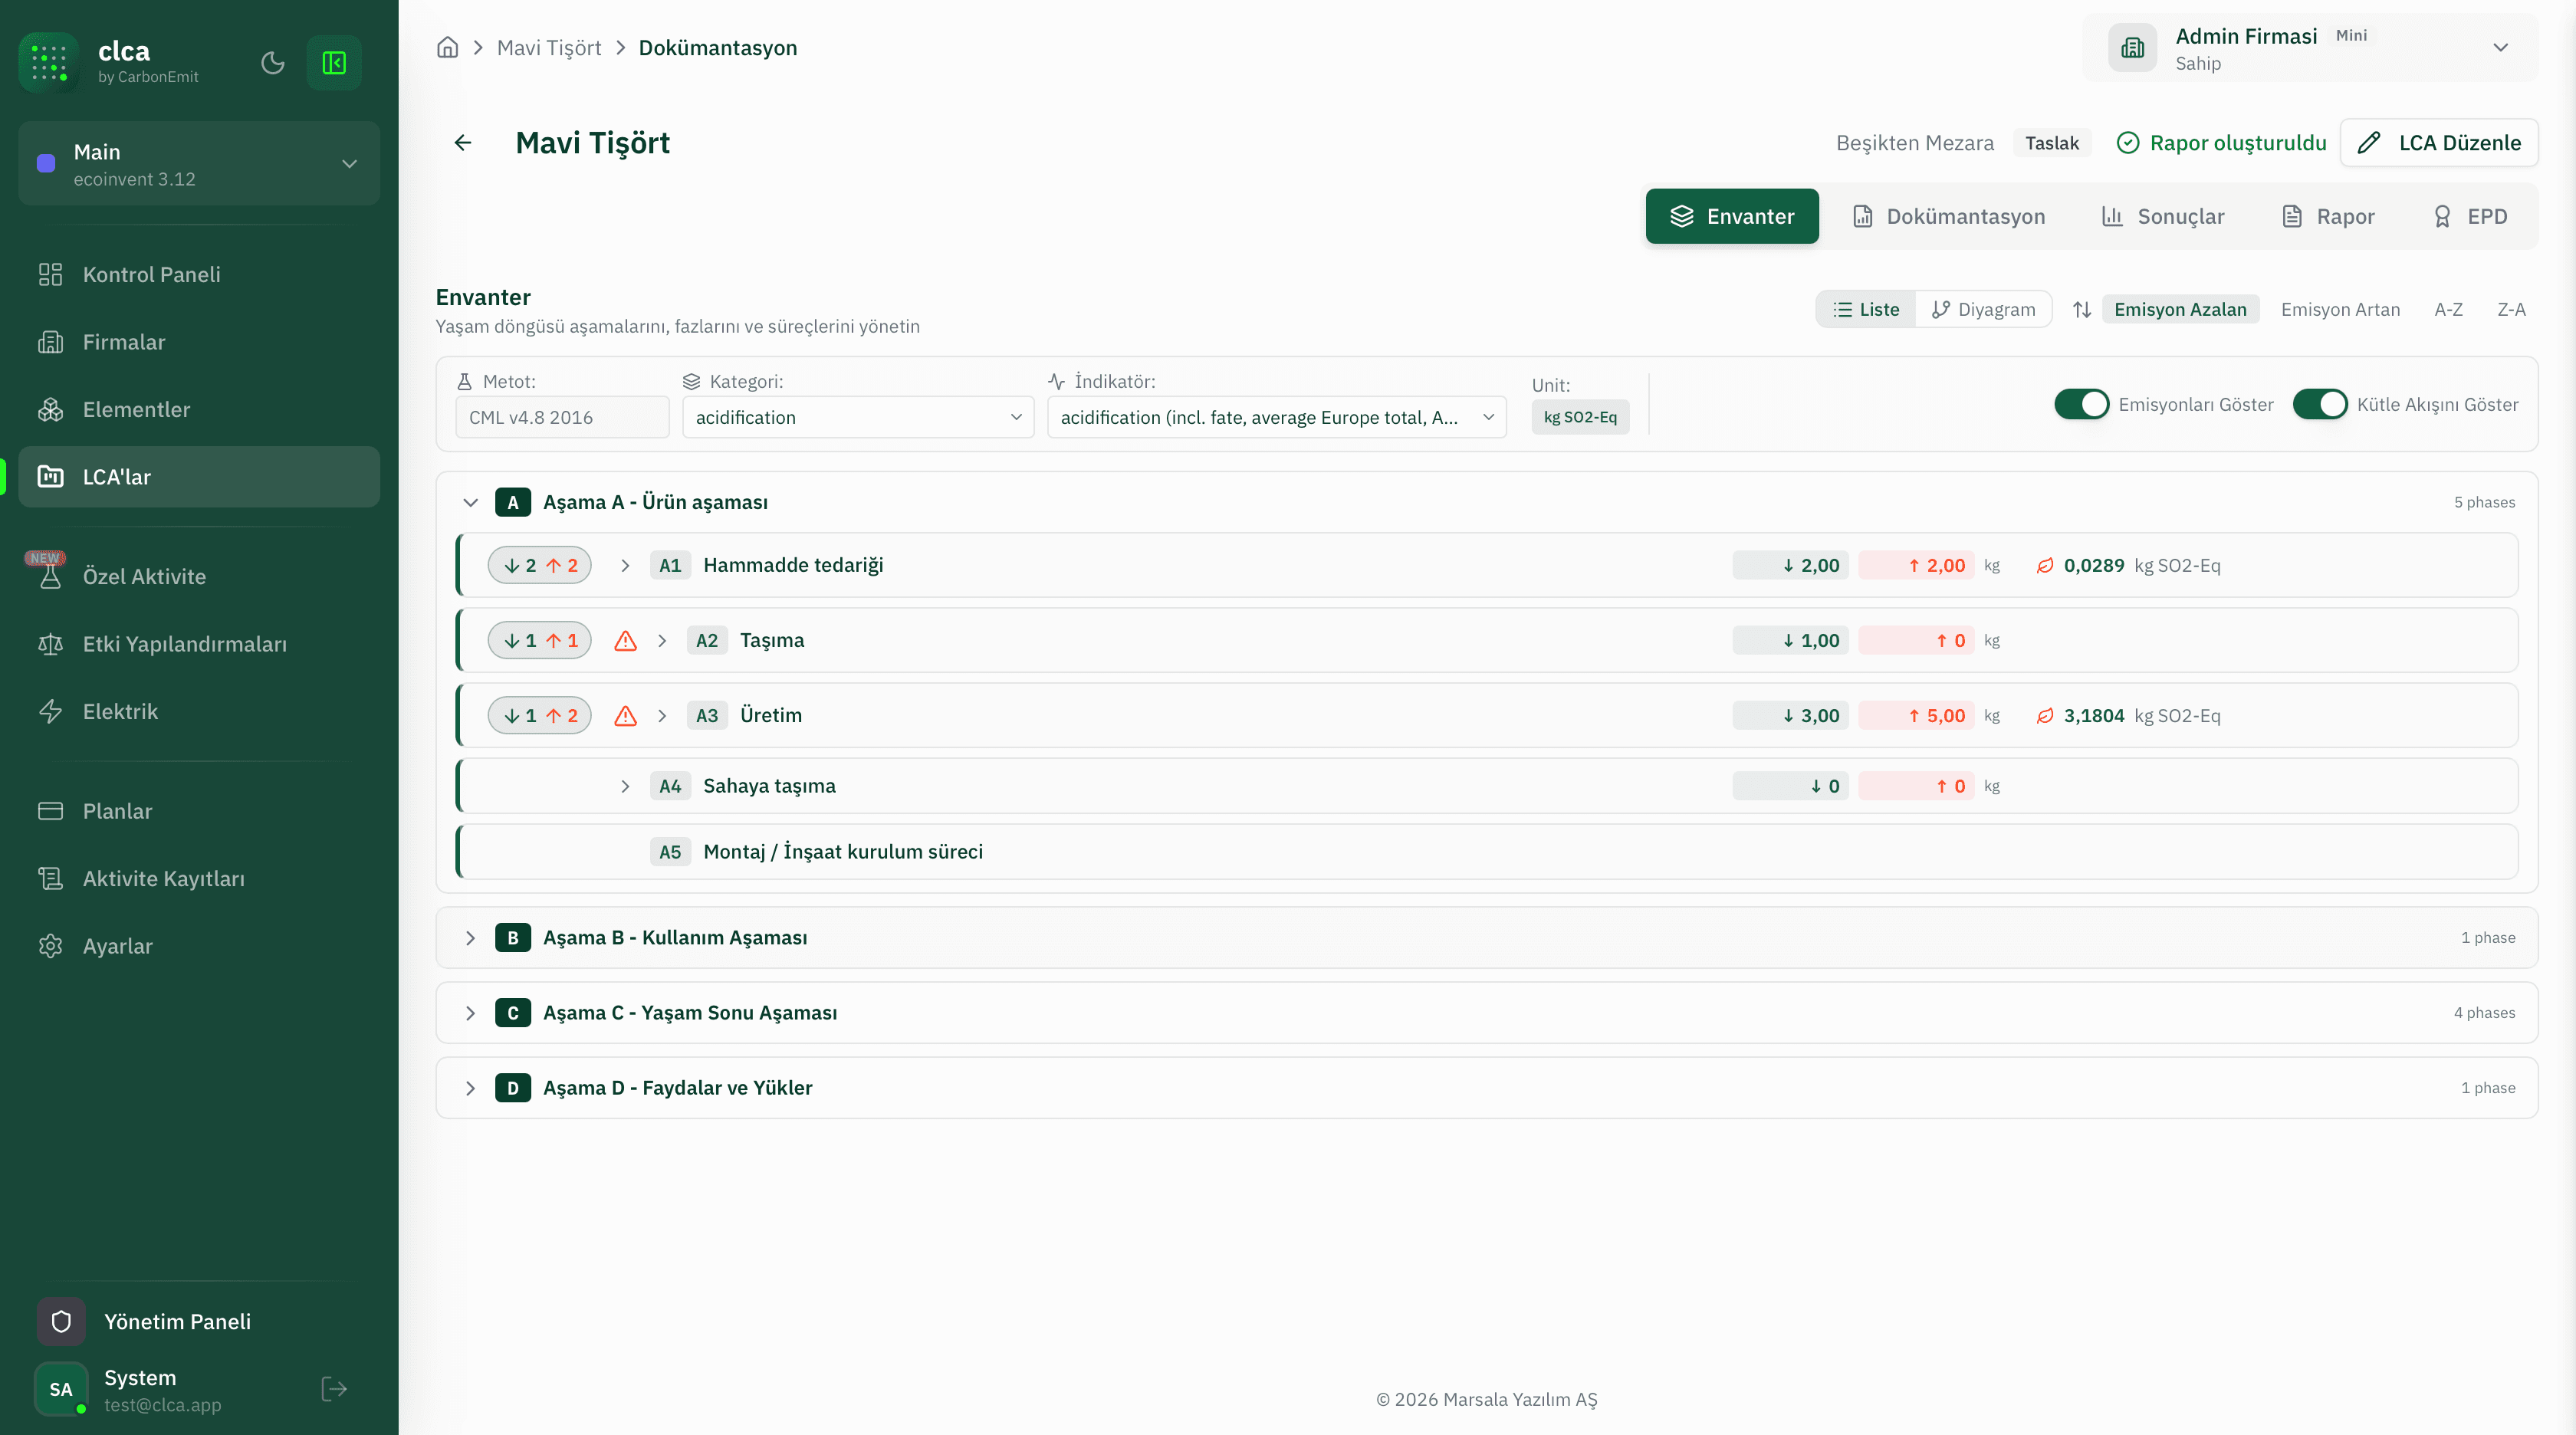
LCA Inventory — Acidification Impact, Product Stage (A1–A5)
The list view of the Inventory module maps every input flow of the product stage (A1–A5) against the ecoinvent database and ranks impact values for the selected indicator (acidification, kg SO2-Eq). 'Show emissions' and 'Show mass flow' filters streamline analysis.
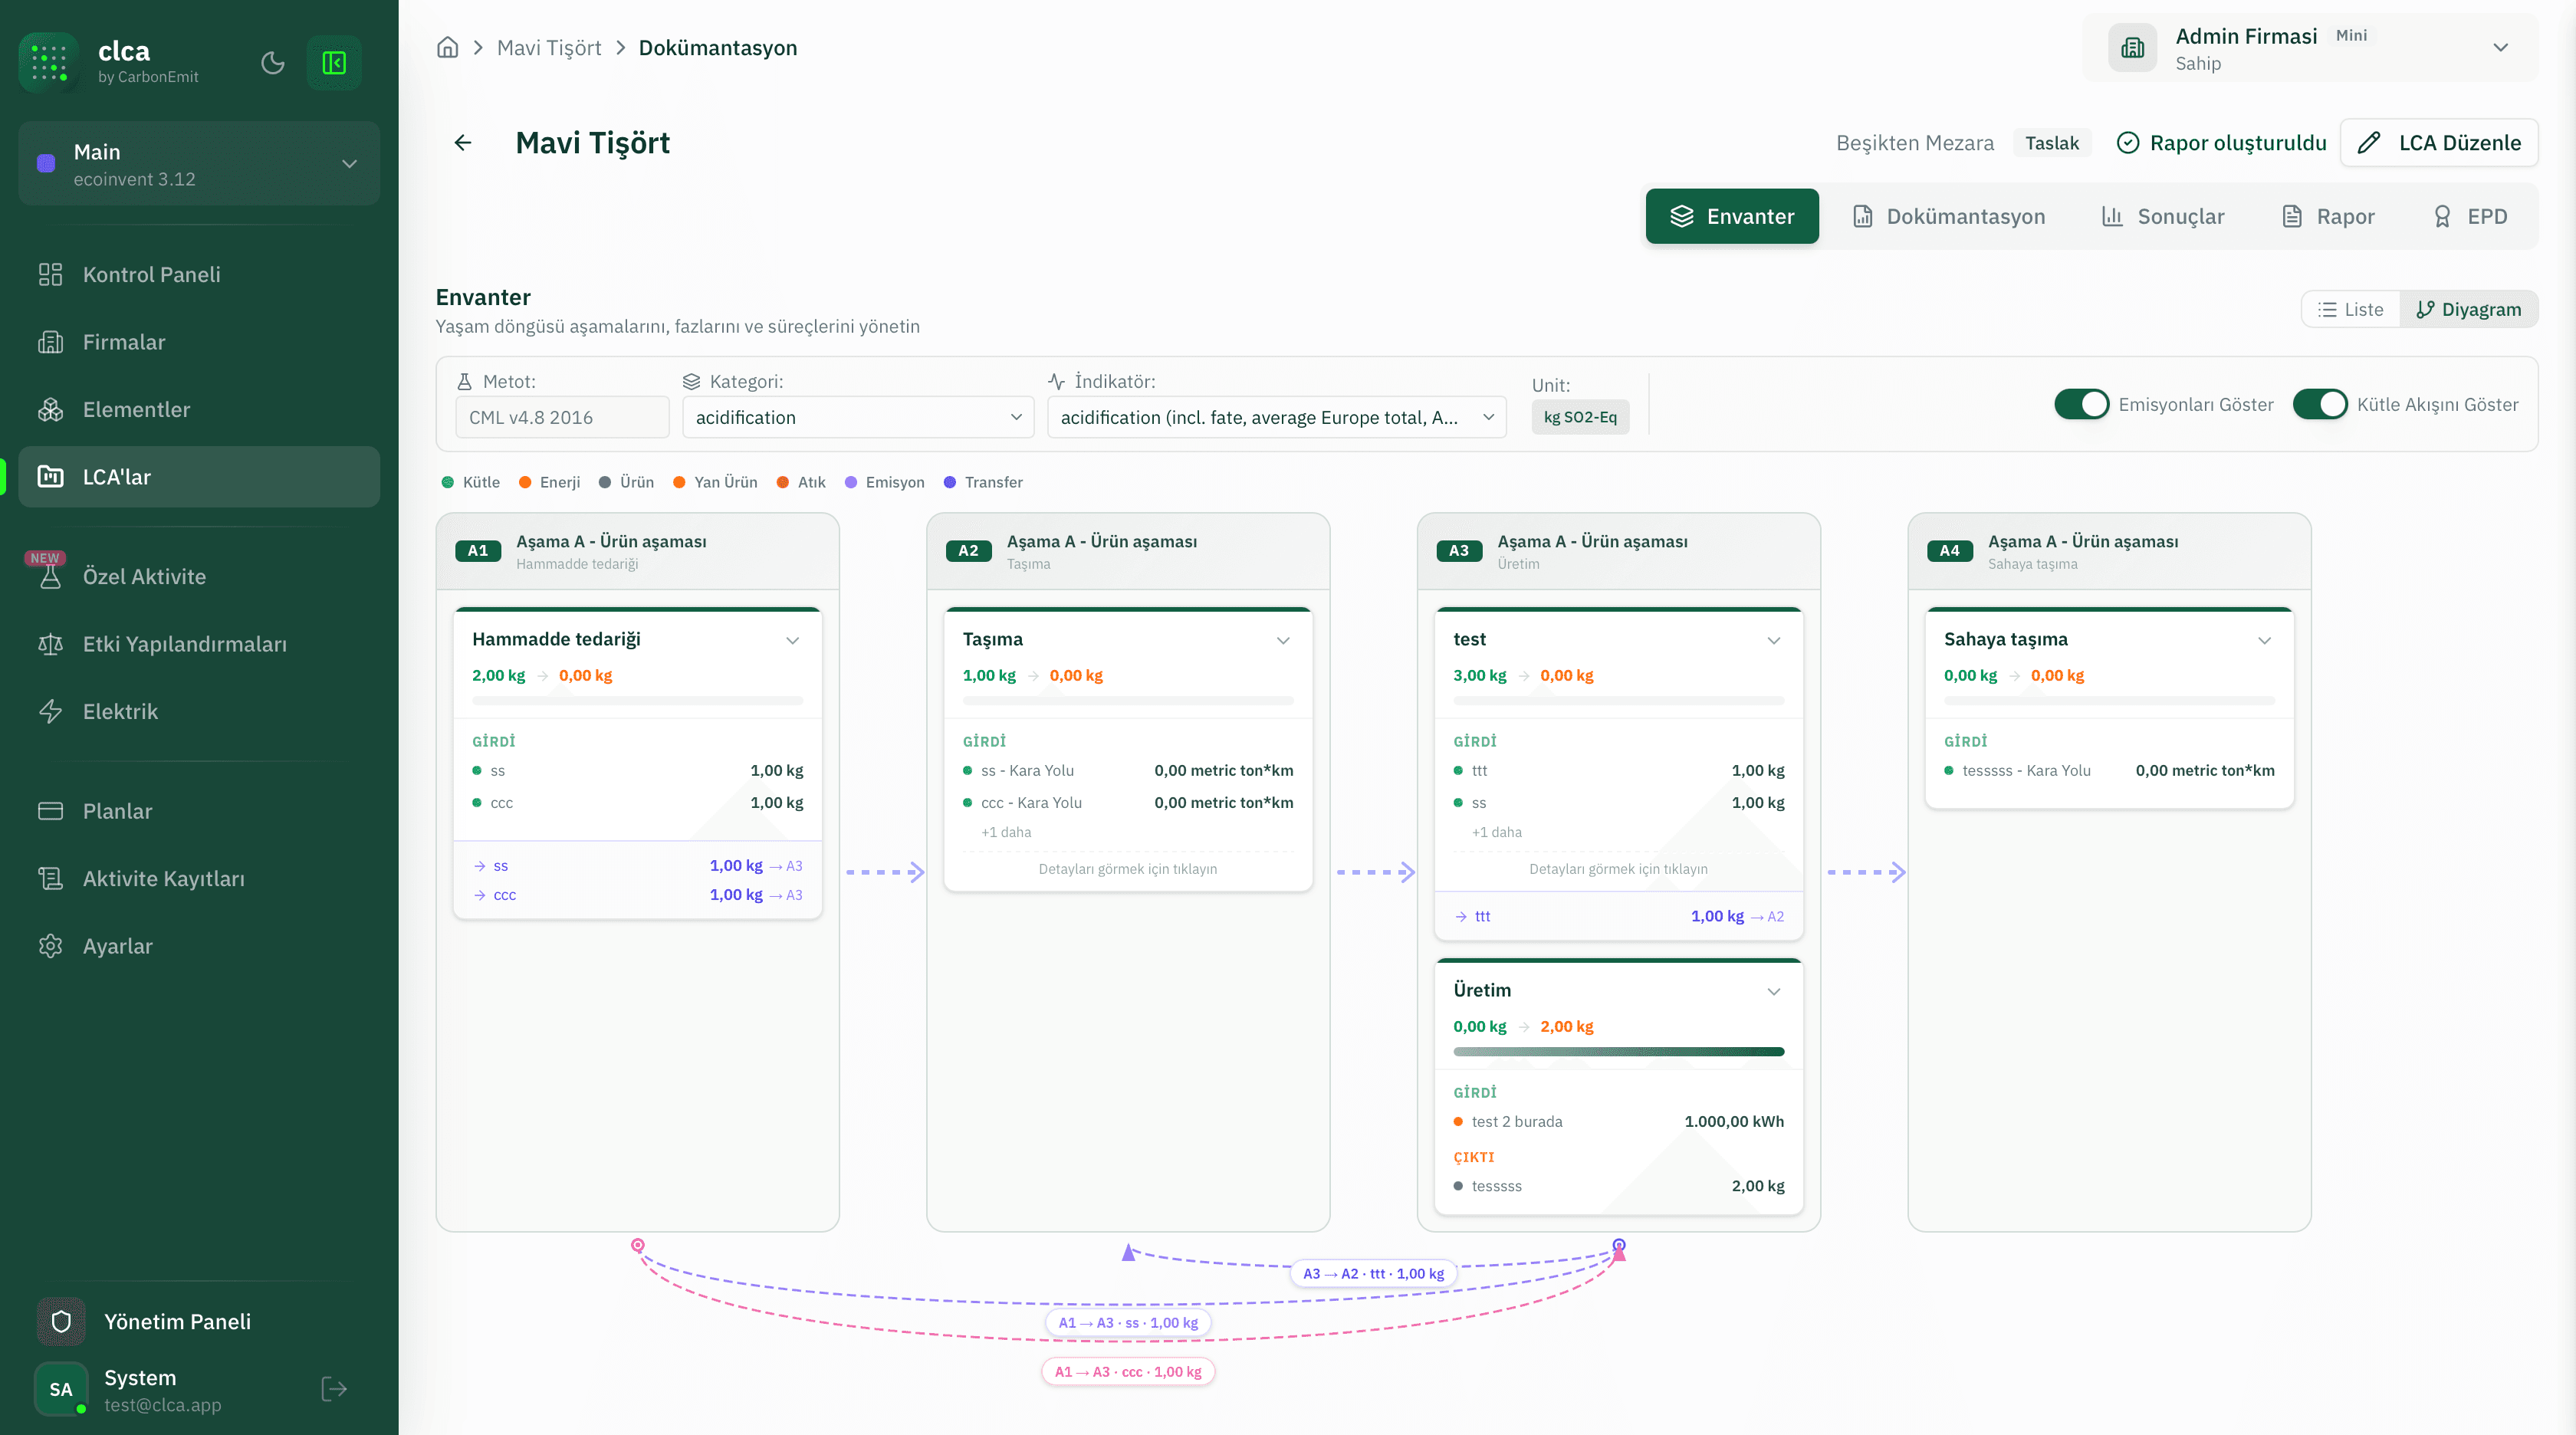
Process Network Diagram — Inter-stage Flow Visualisation
The Process Network Diagram renders each stage as an independent card and visualises product and substance flows between cards with colour-coded arrows. Flow amounts are labelled on each arrow, enabling quick verification of inventory consistency and inter-stage dependencies.
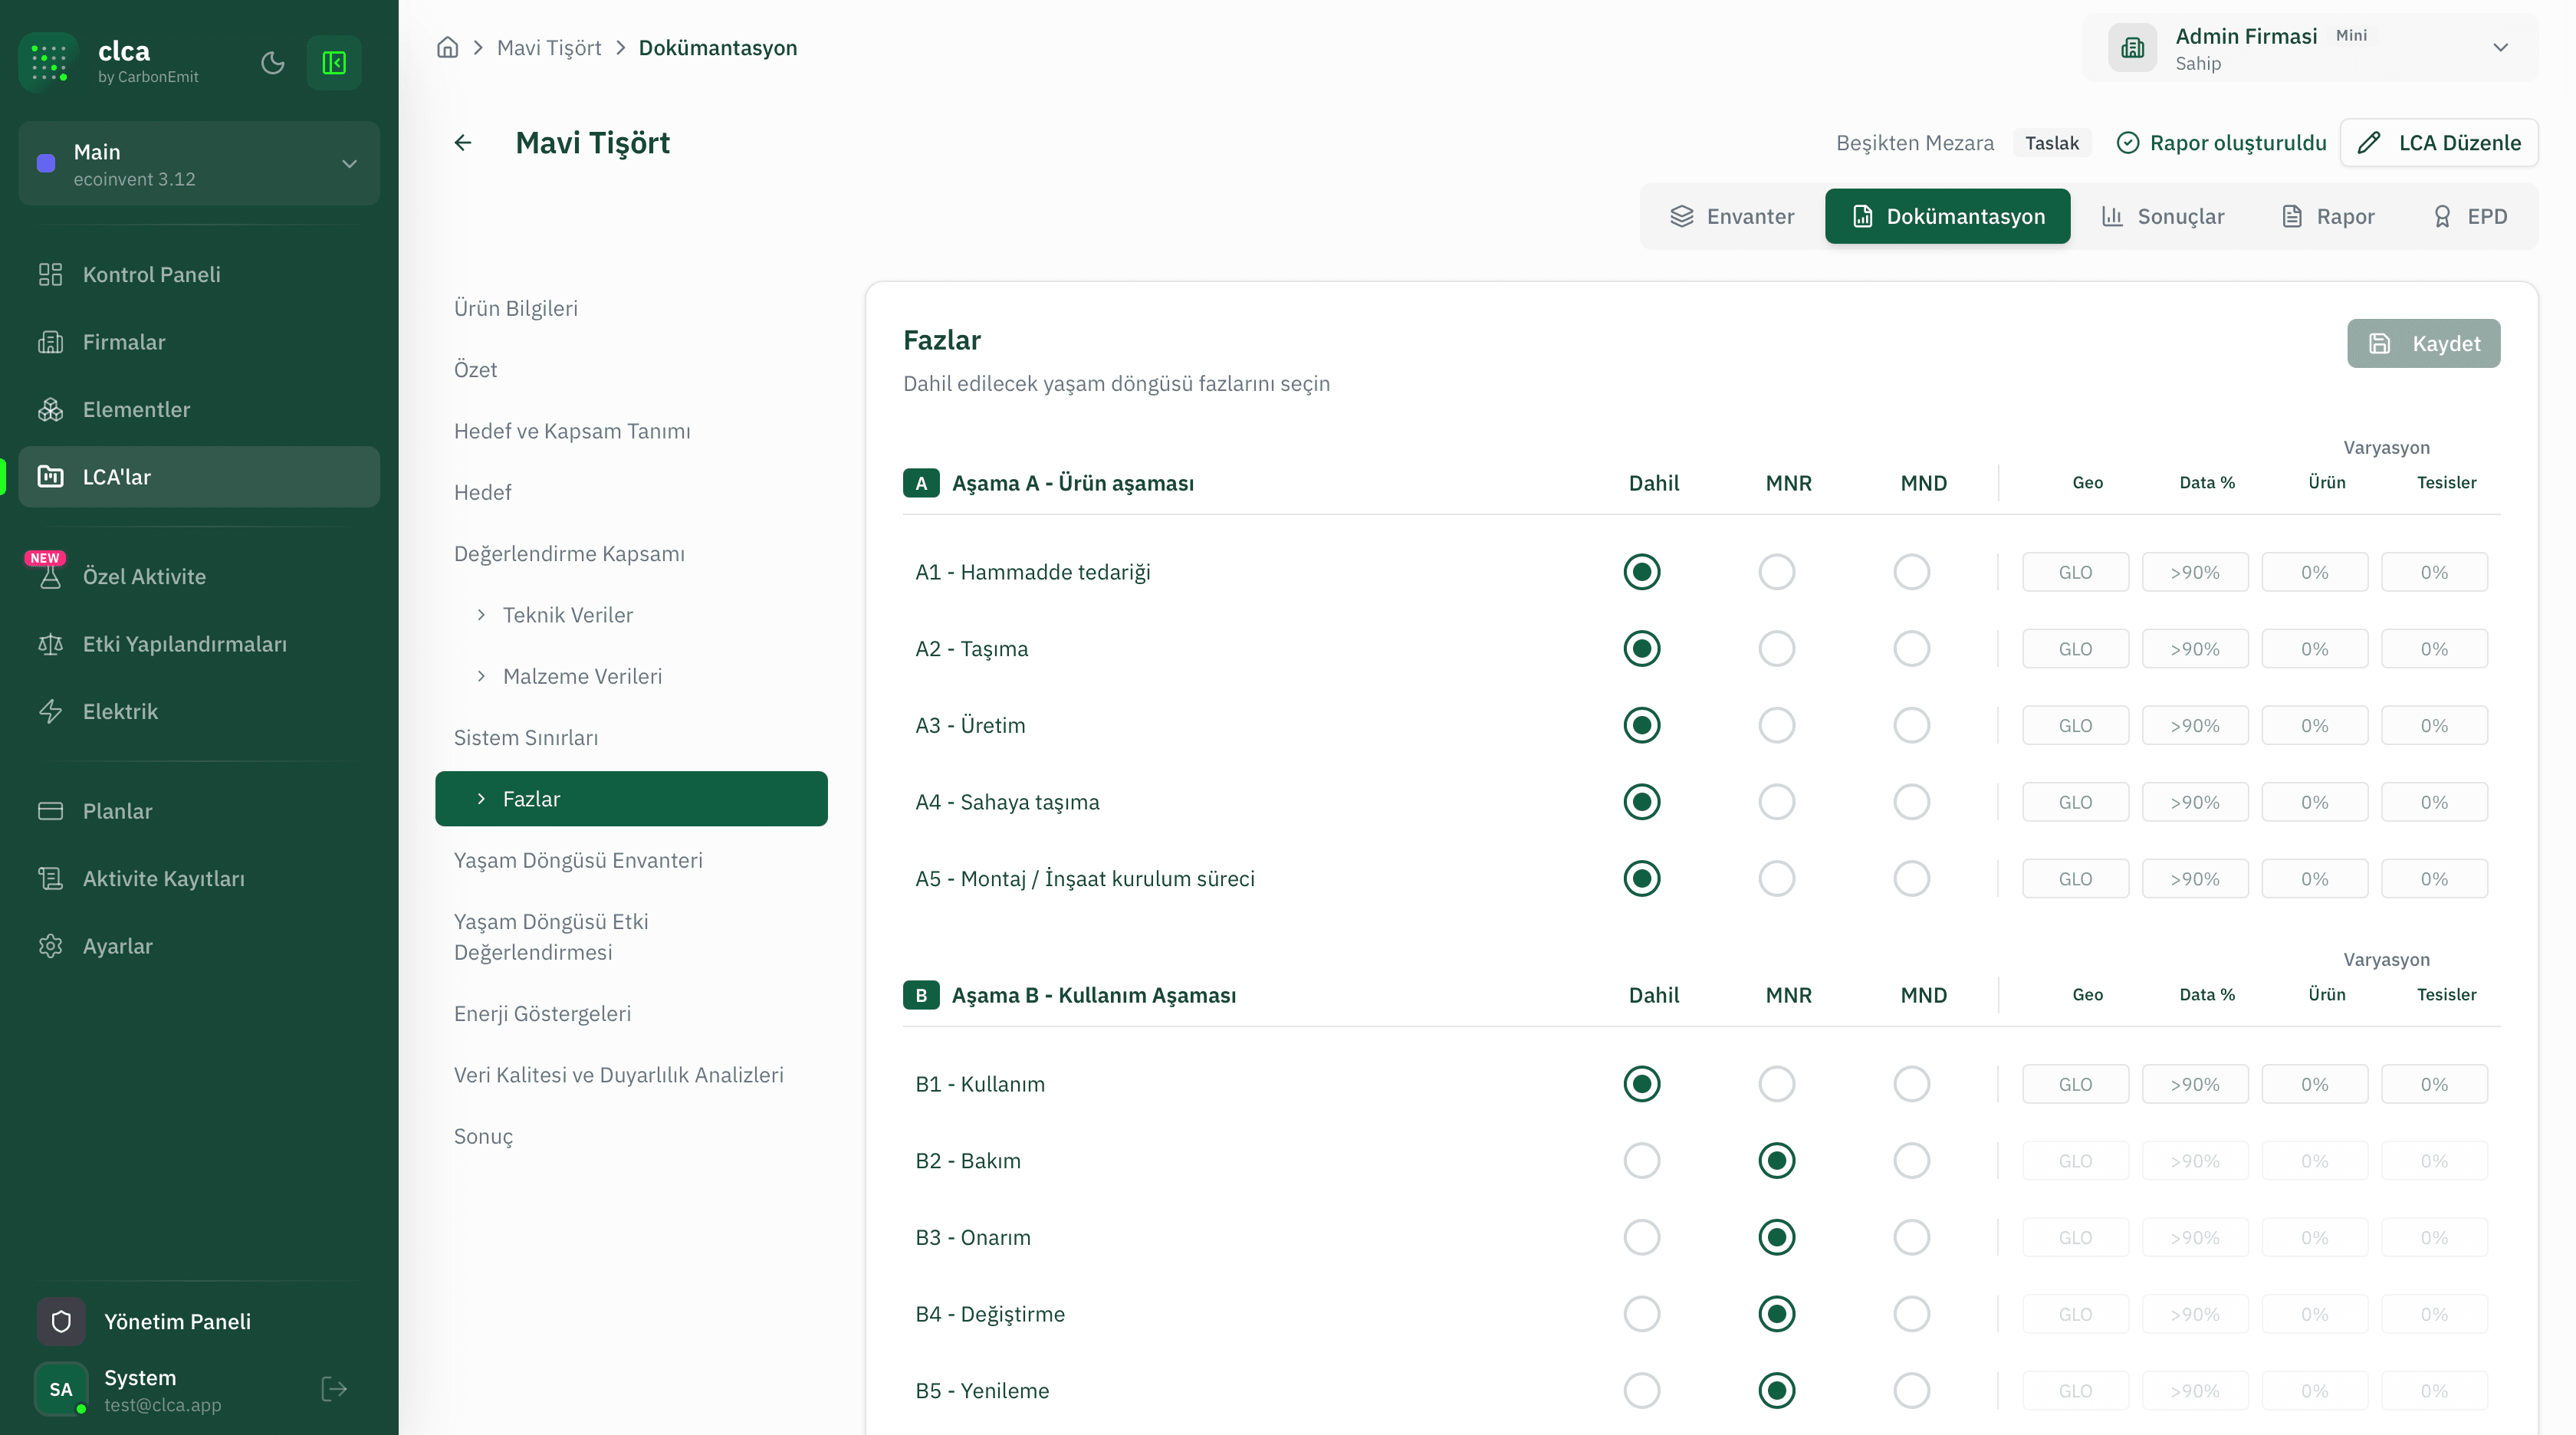
Documentation — EN 15804 Life Cycle Phases Selection
Documentation module screen for marking life cycle stages (A1–A5, B1–B7, C1–C4, D) included per EN 15804. Each stage configures its Included/MNR/MND status, geographic scope (GLO), data quality percentage and product/facility variation values.
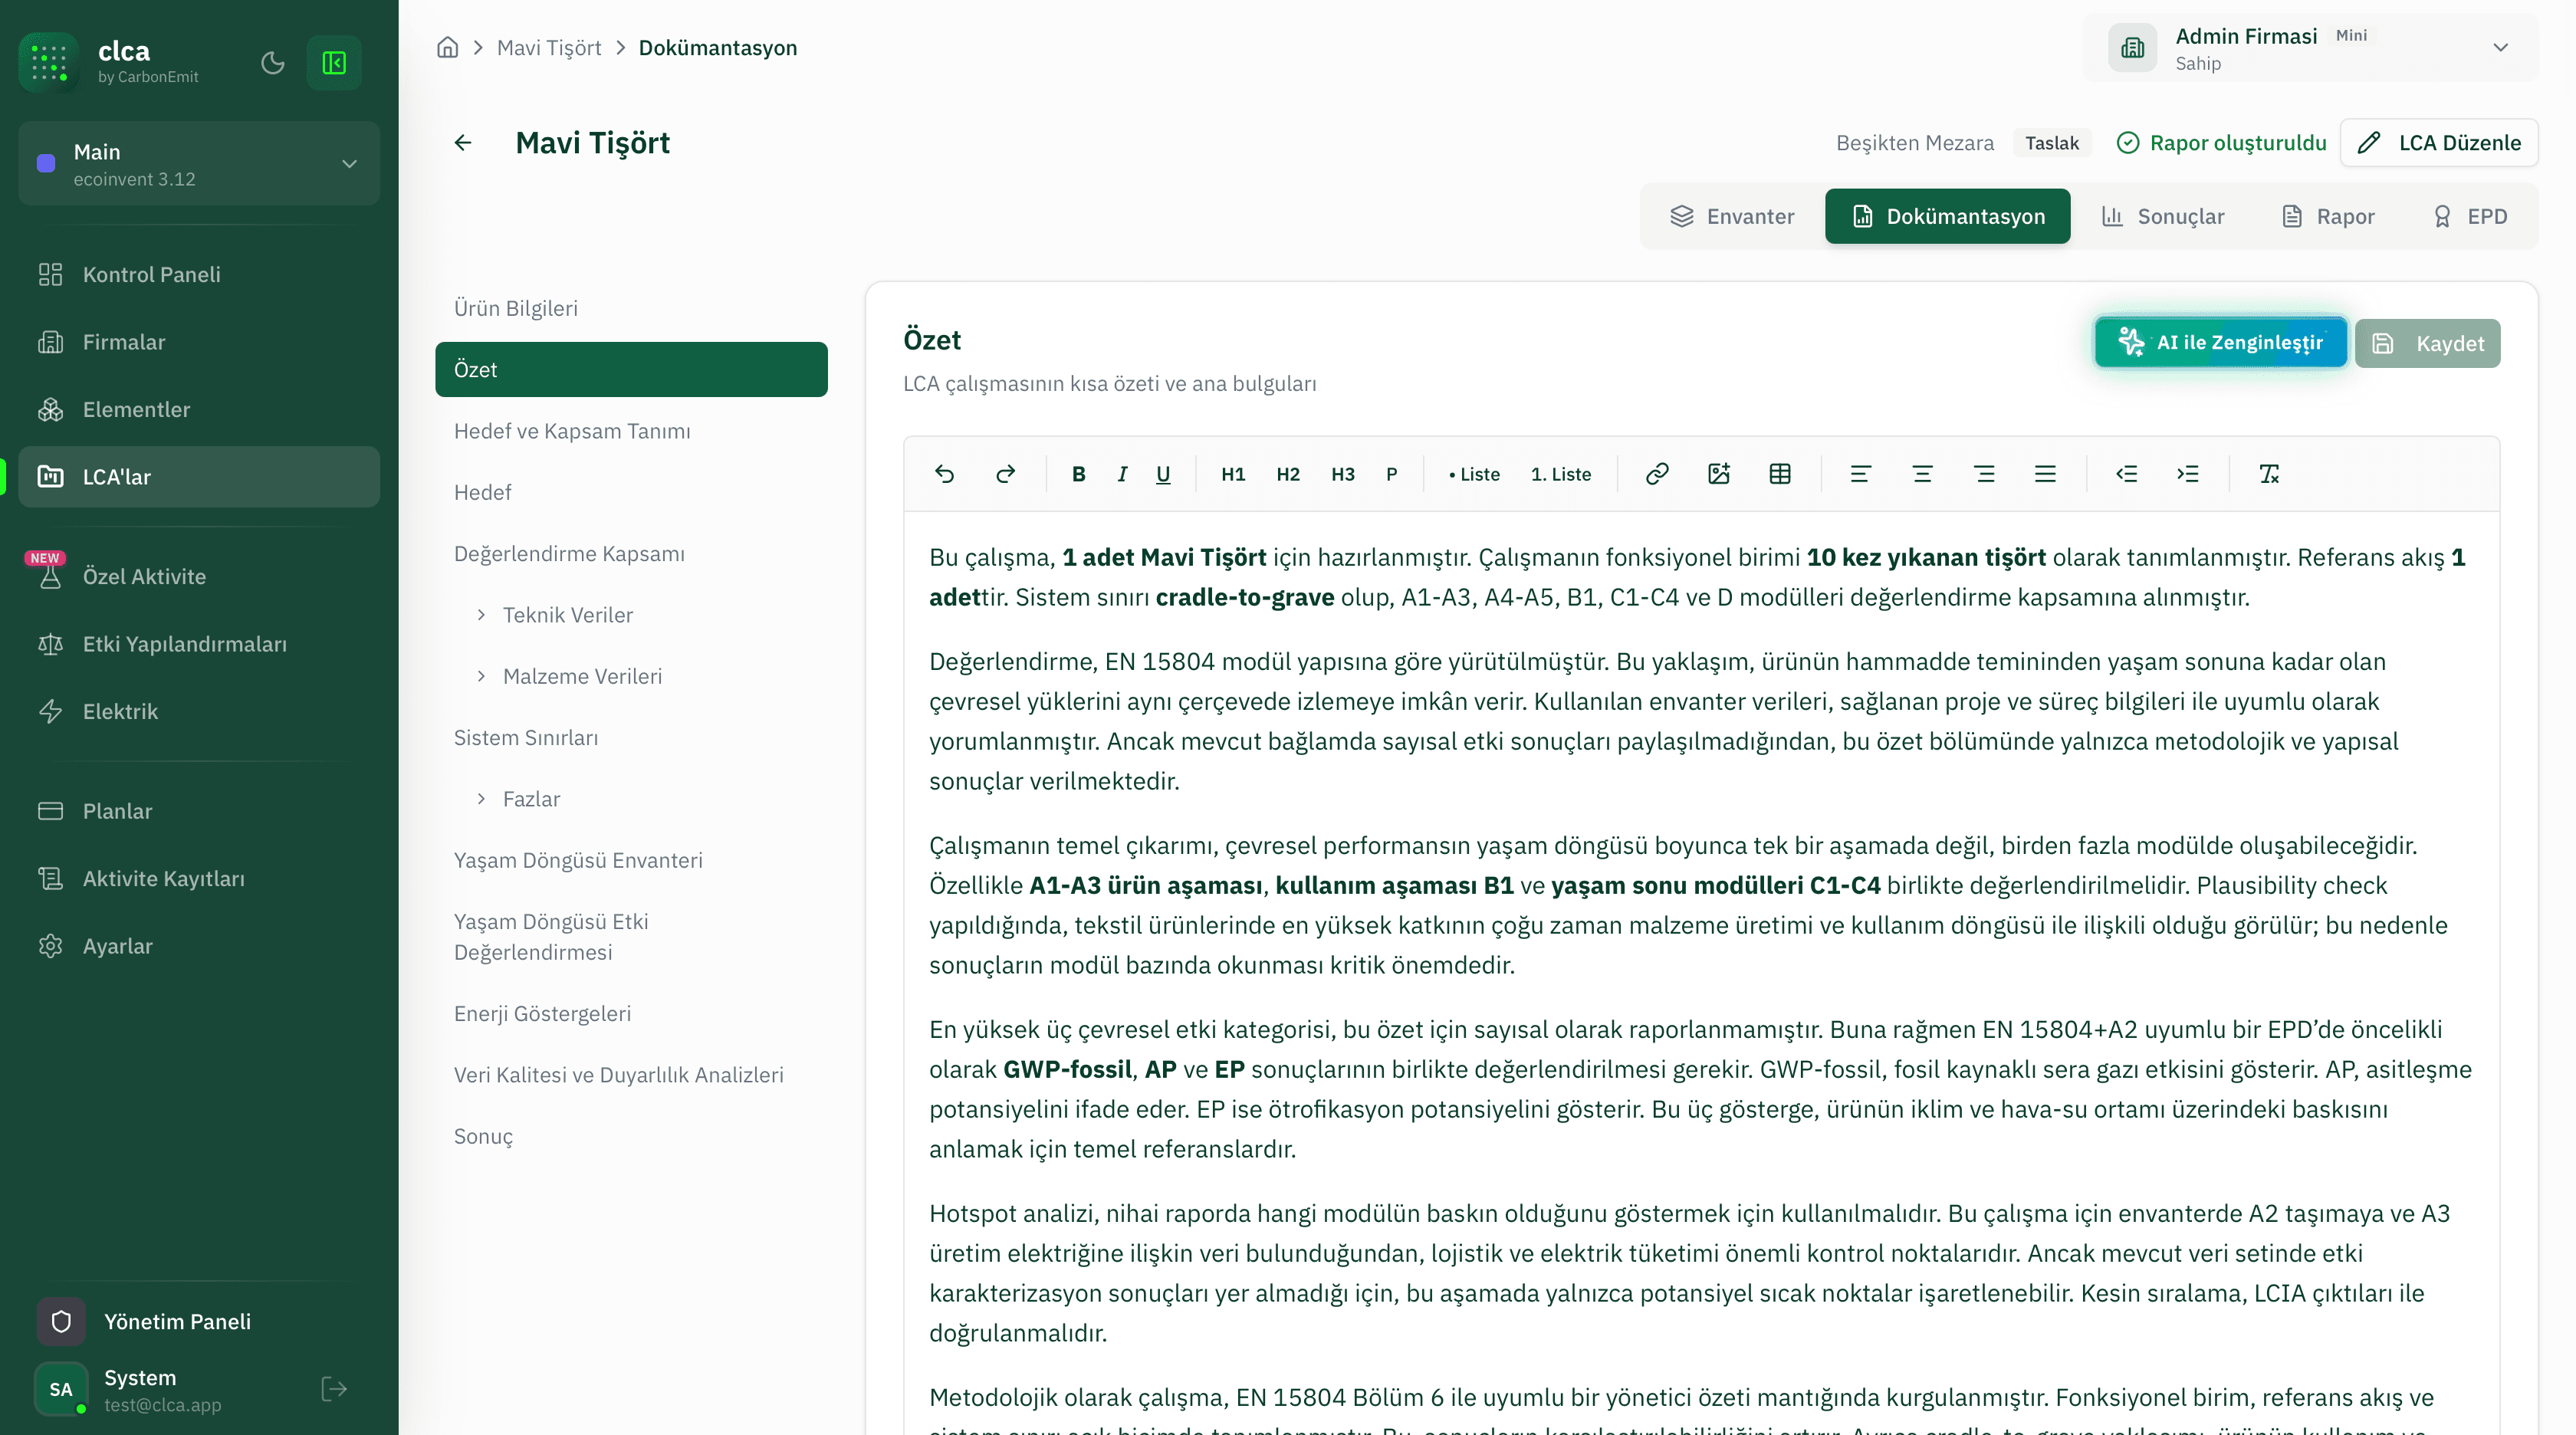
Documentation — Summary Section and Rich Text Editor
The Documentation module presents every report section (Introduction, Summary, Goal and Scope, System Boundaries, Phases, Inventory, Impact Assessment, Data Quality, Conclusion) in a structured side navigation. A rich text editor plus the 'Enrich with AI' feature speeds up writing standard-compliant narrative text.
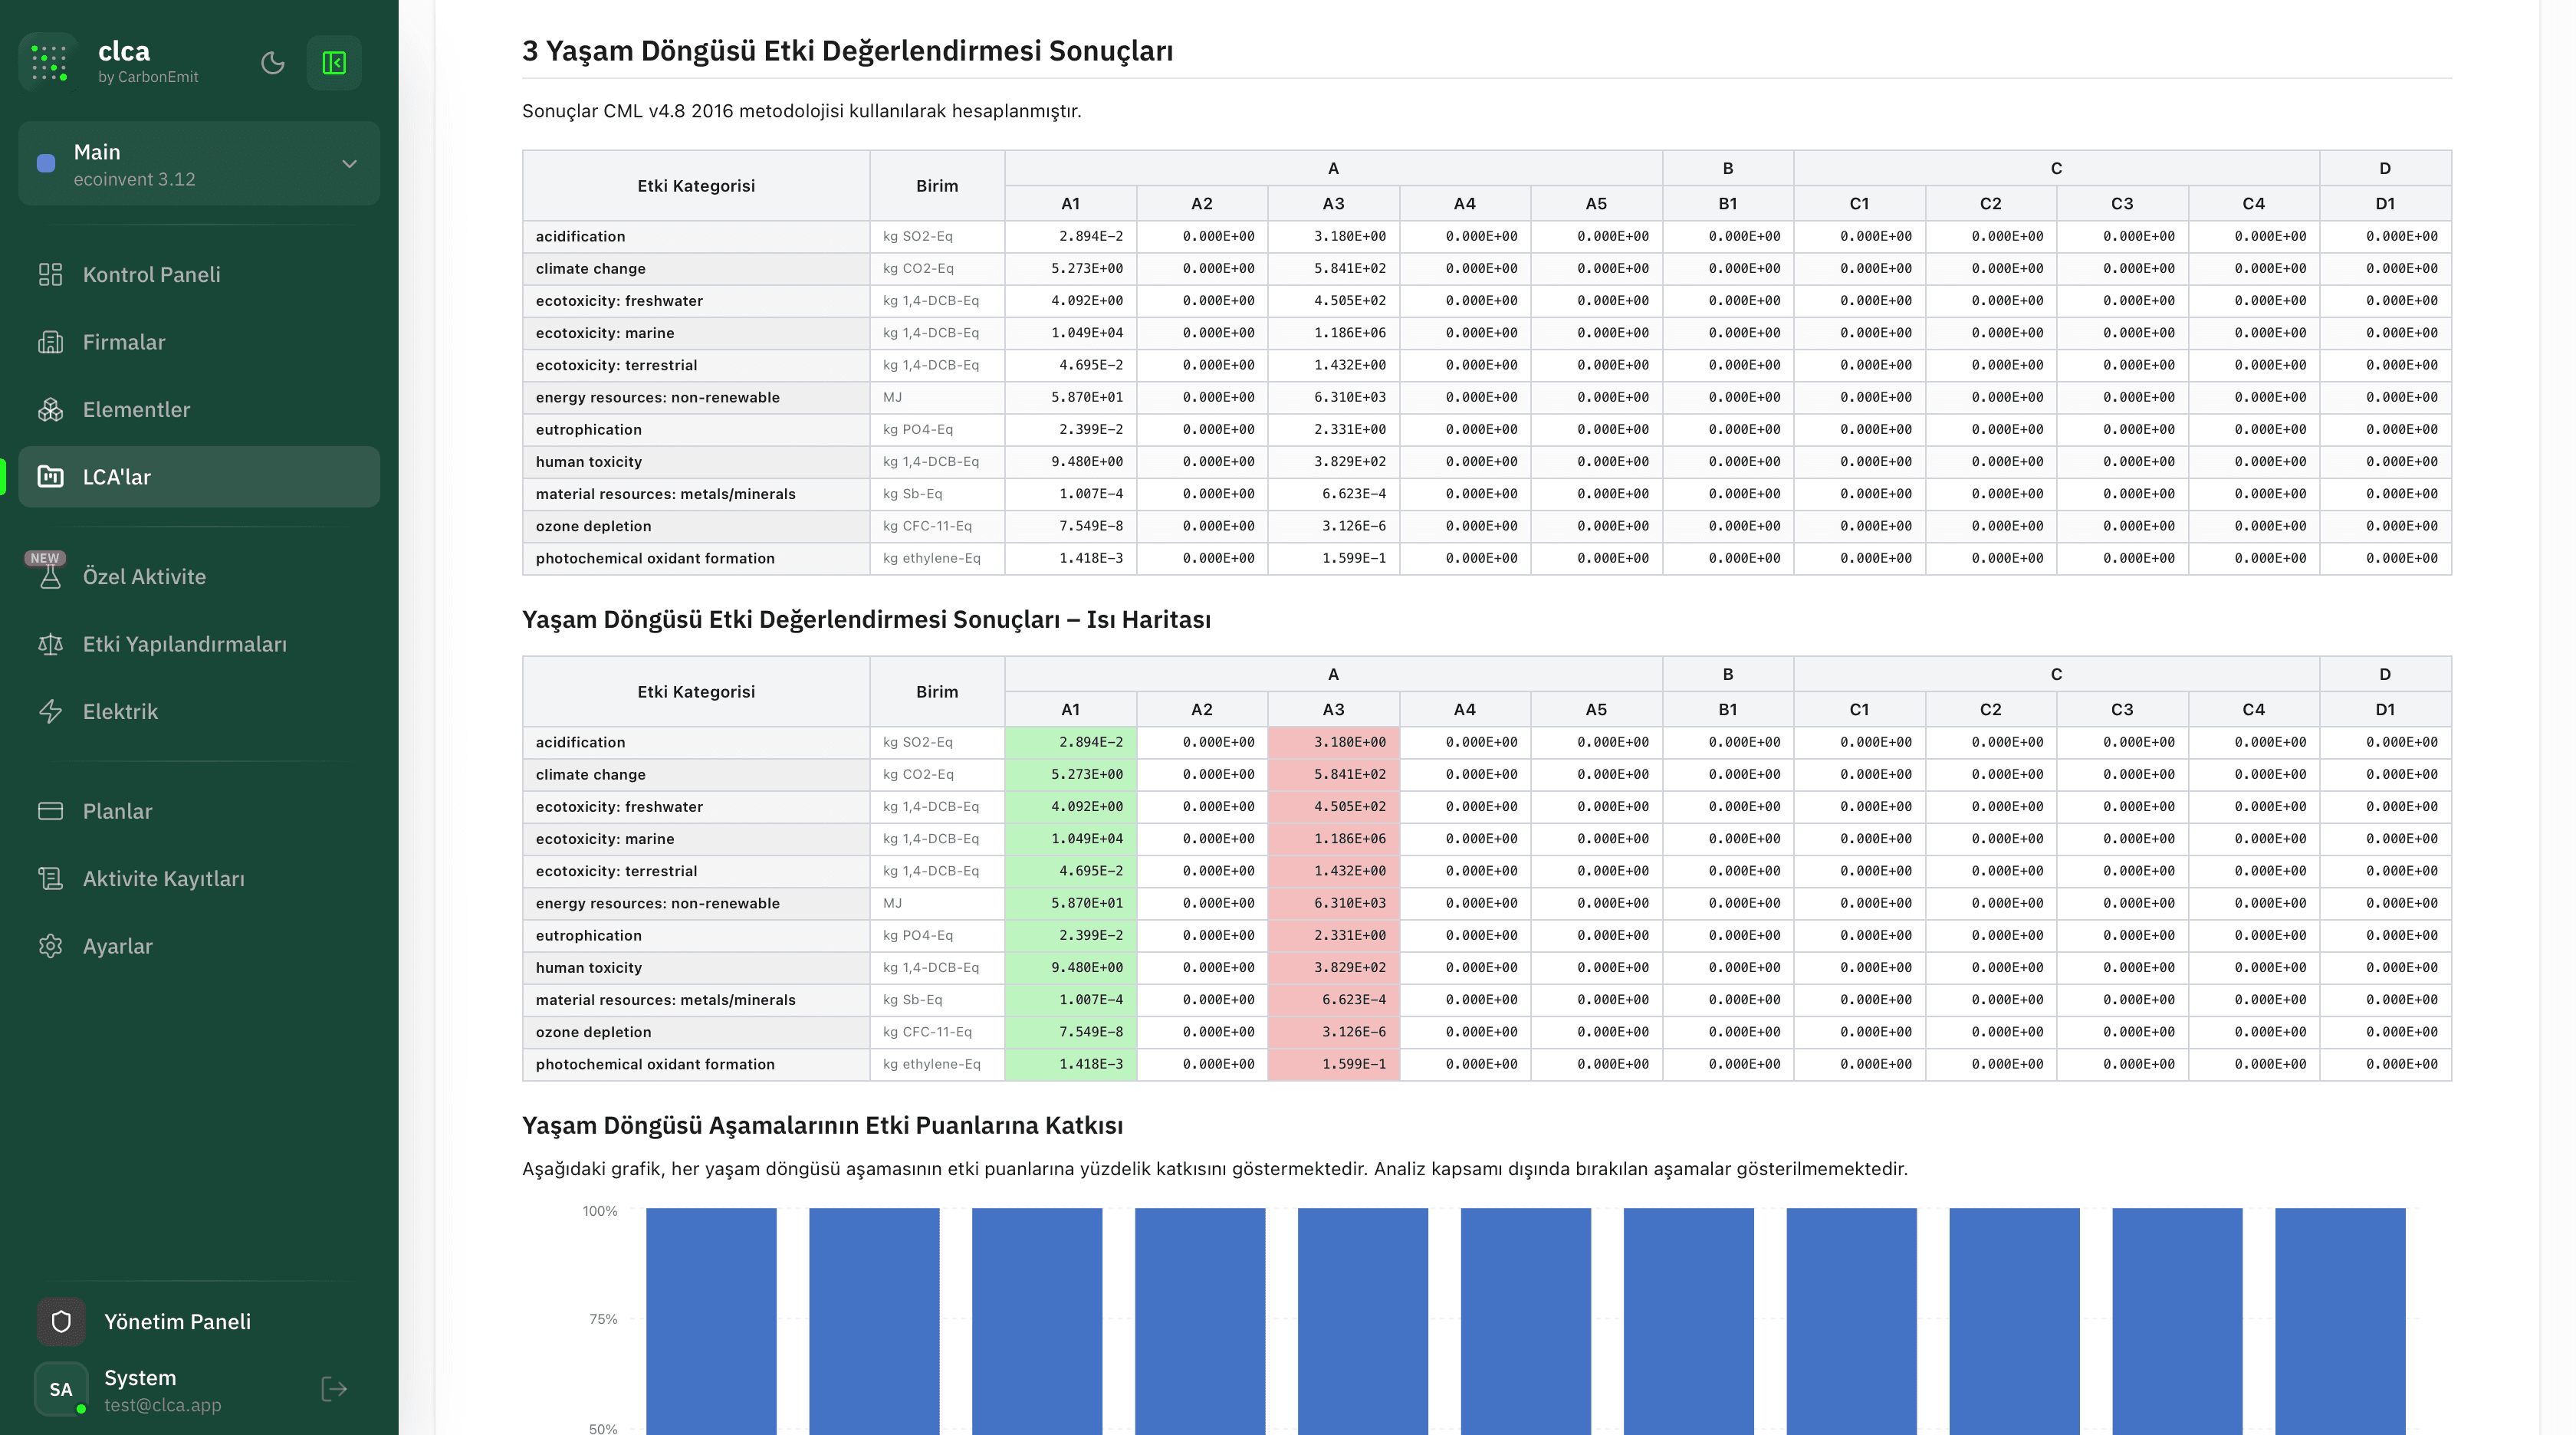
LCA Results — Impact Assessment Tables and Heatmap
The Results module aggregates every impact category across life cycle stages (A1–D) in a table for the selected method (CML v4.8 2016). A colour heatmap highlights impact hotspots, while a stacked bar chart compares each stage's contribution to the impact scores.
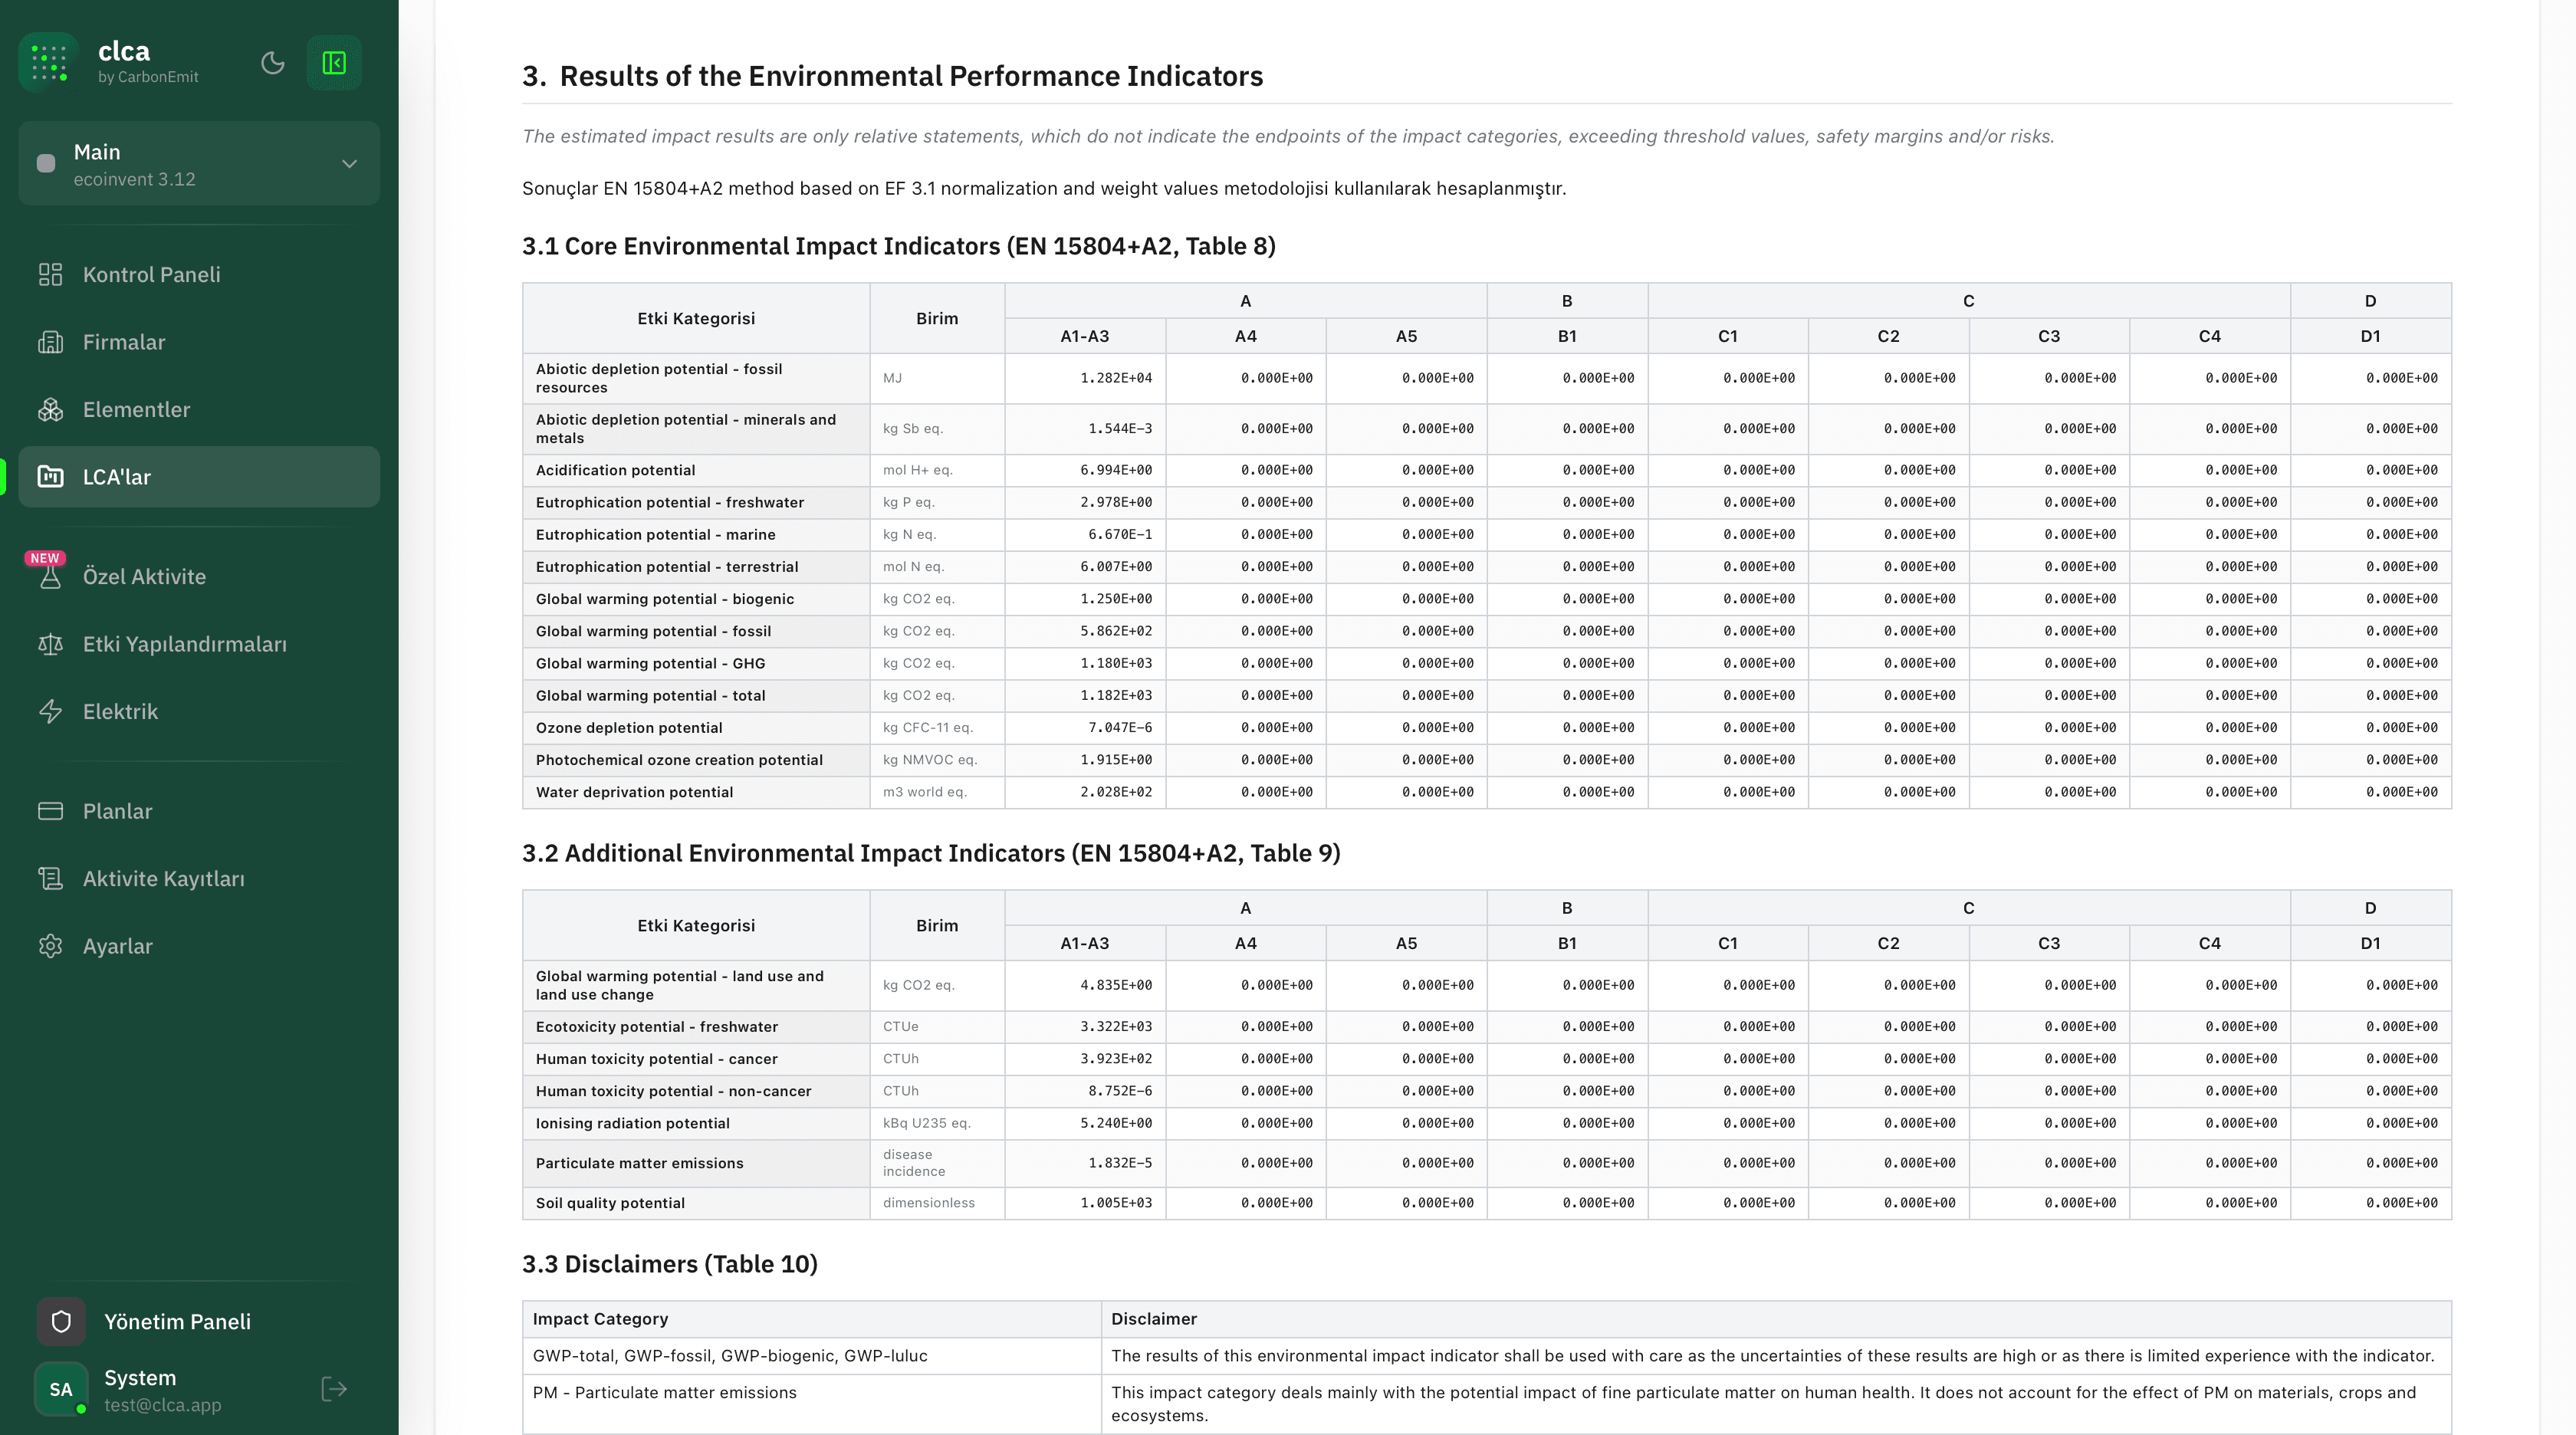
EPD Report — EN 15804+A2 Environmental Performance Indicators
The EPD module auto-generates the Environmental Performance Indicators section from a standard template. Tables include all mandatory core (Table 8) and additional (Table 9) indicators for A1–A5, B1–B7, C1–C4 and D modules; disclaimer texts (Table 10) are filled from pre-defined templates.
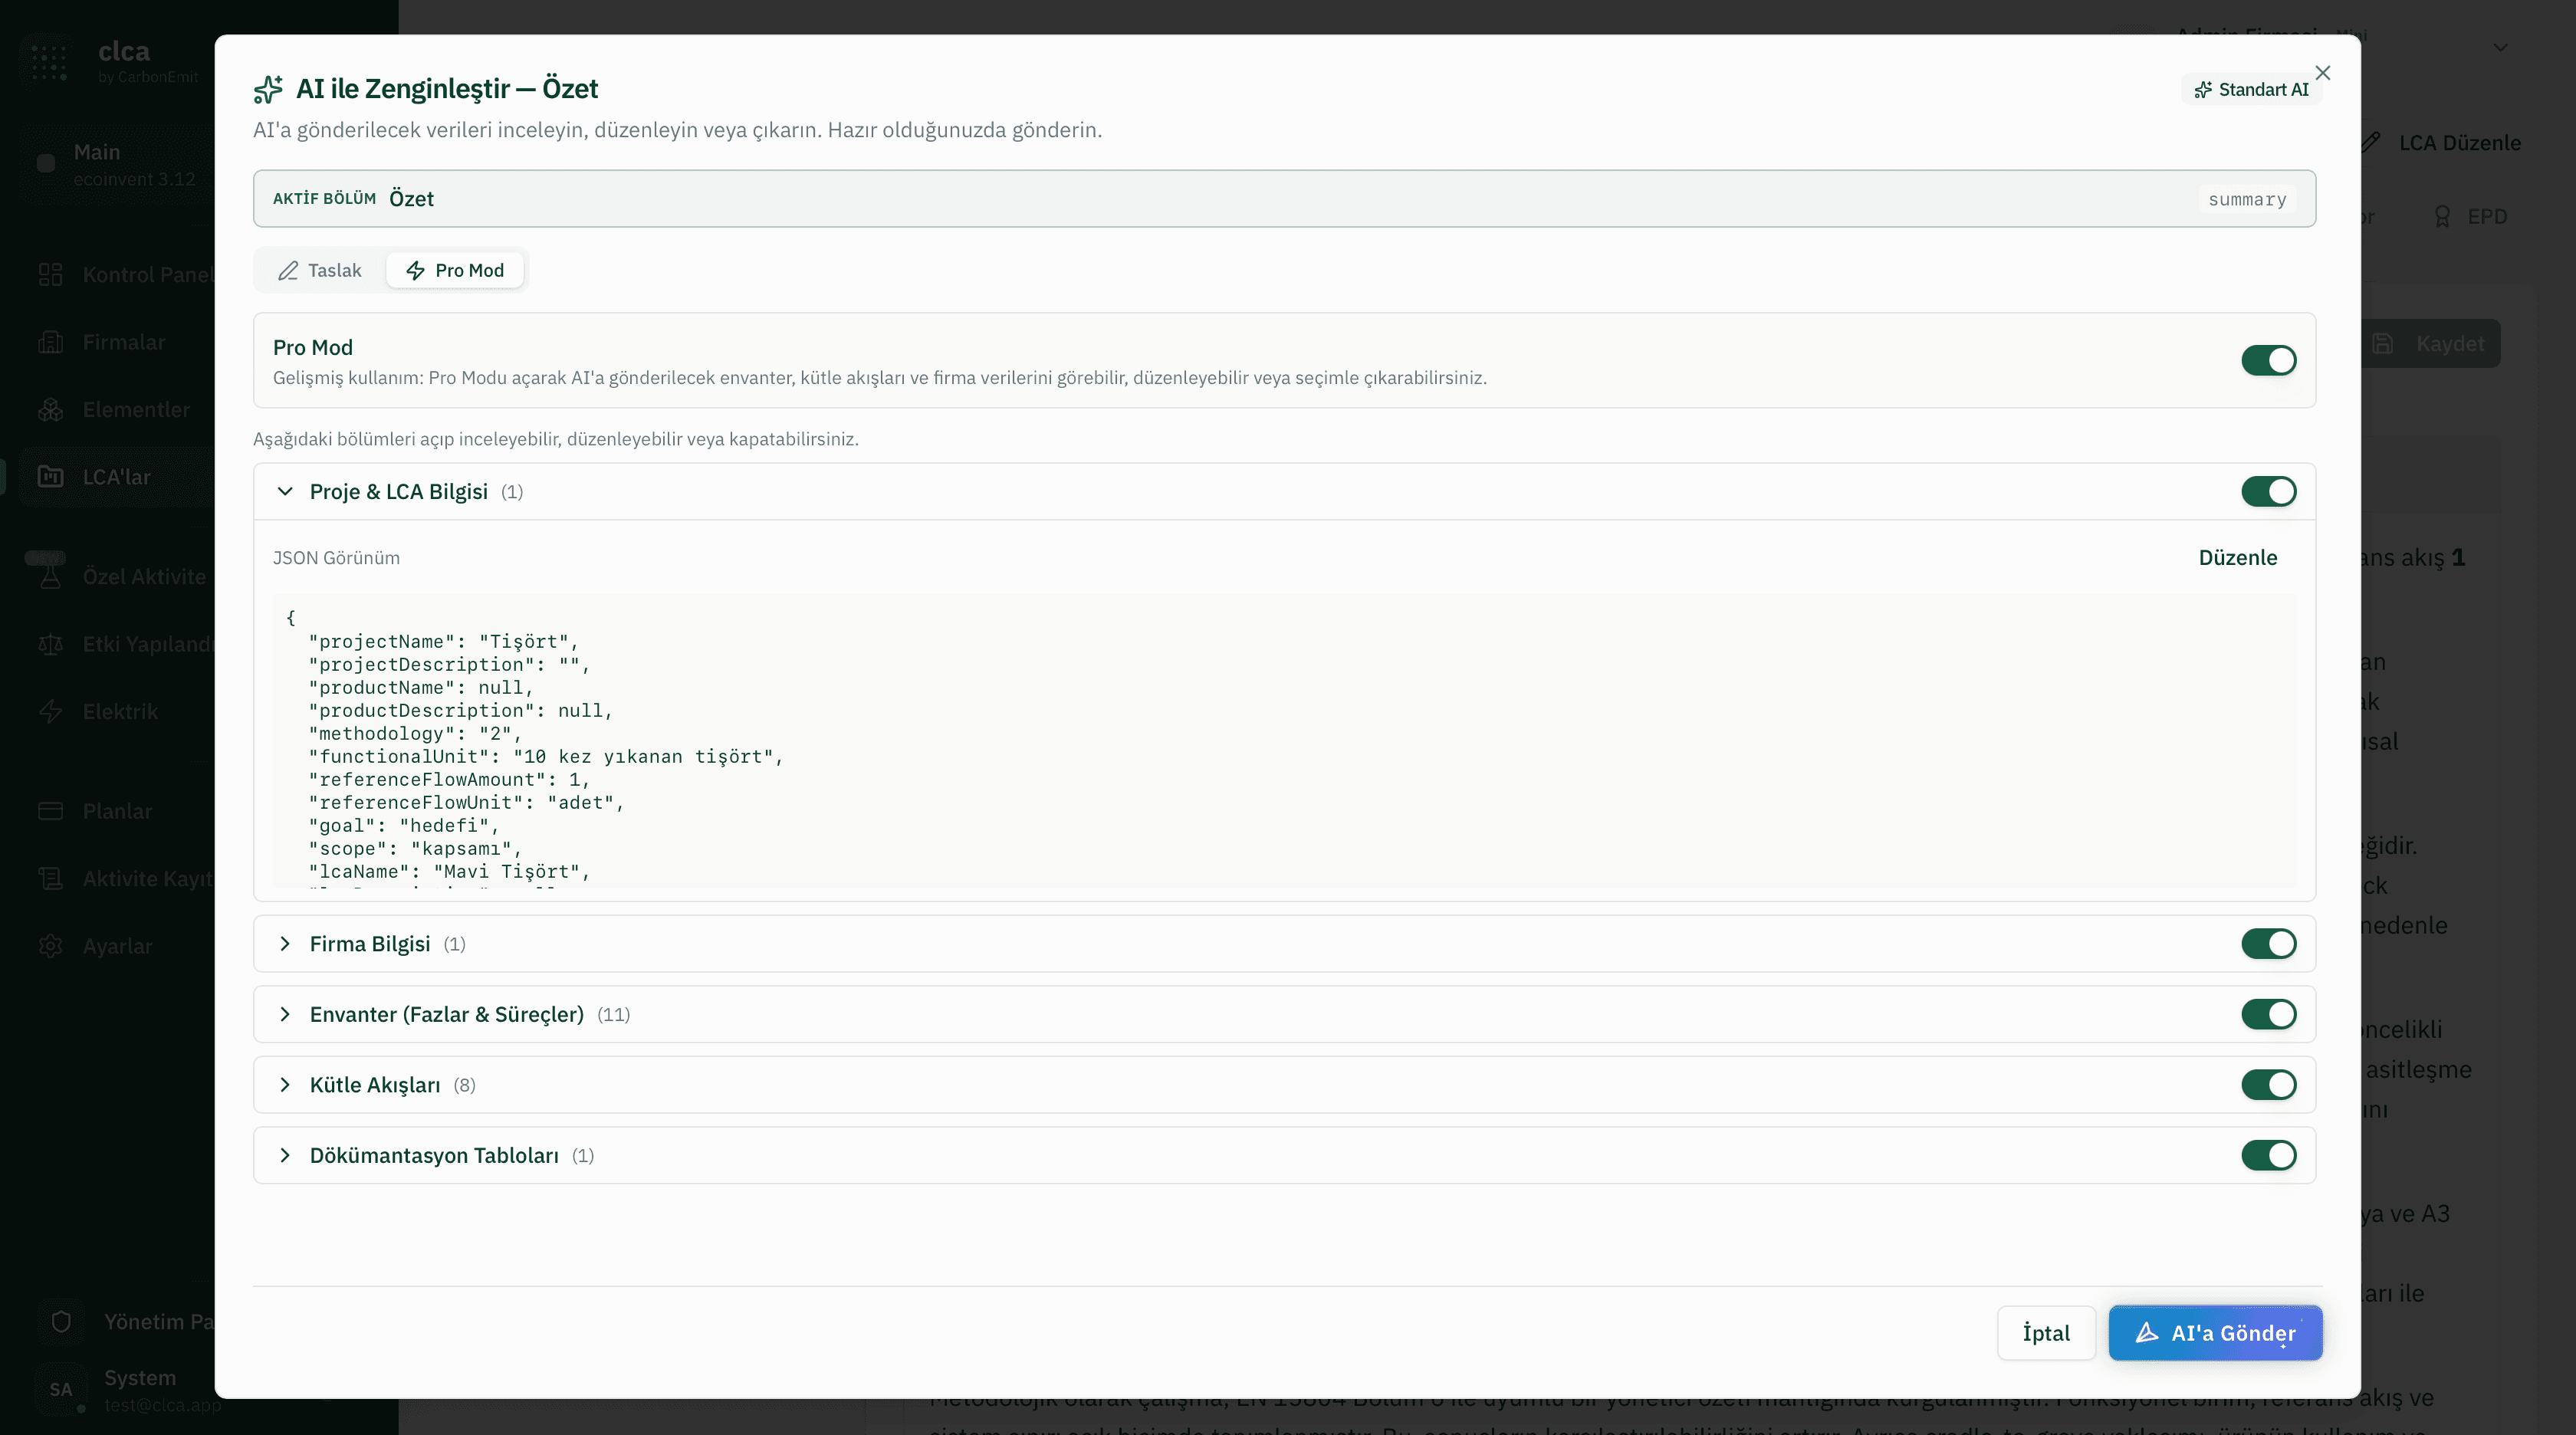
Enrich with AI — LCA Data Review and Submission Modal
The 'Enrich with AI' modal transparently shows every piece of data sent to the AI (project & LCA info, company info, inventory phases, mass flows and documentation tables) before submission. With Pro Mode on, each section can be inspected as JSON, edited or excluded from the payload — keeping the user in control of the data.
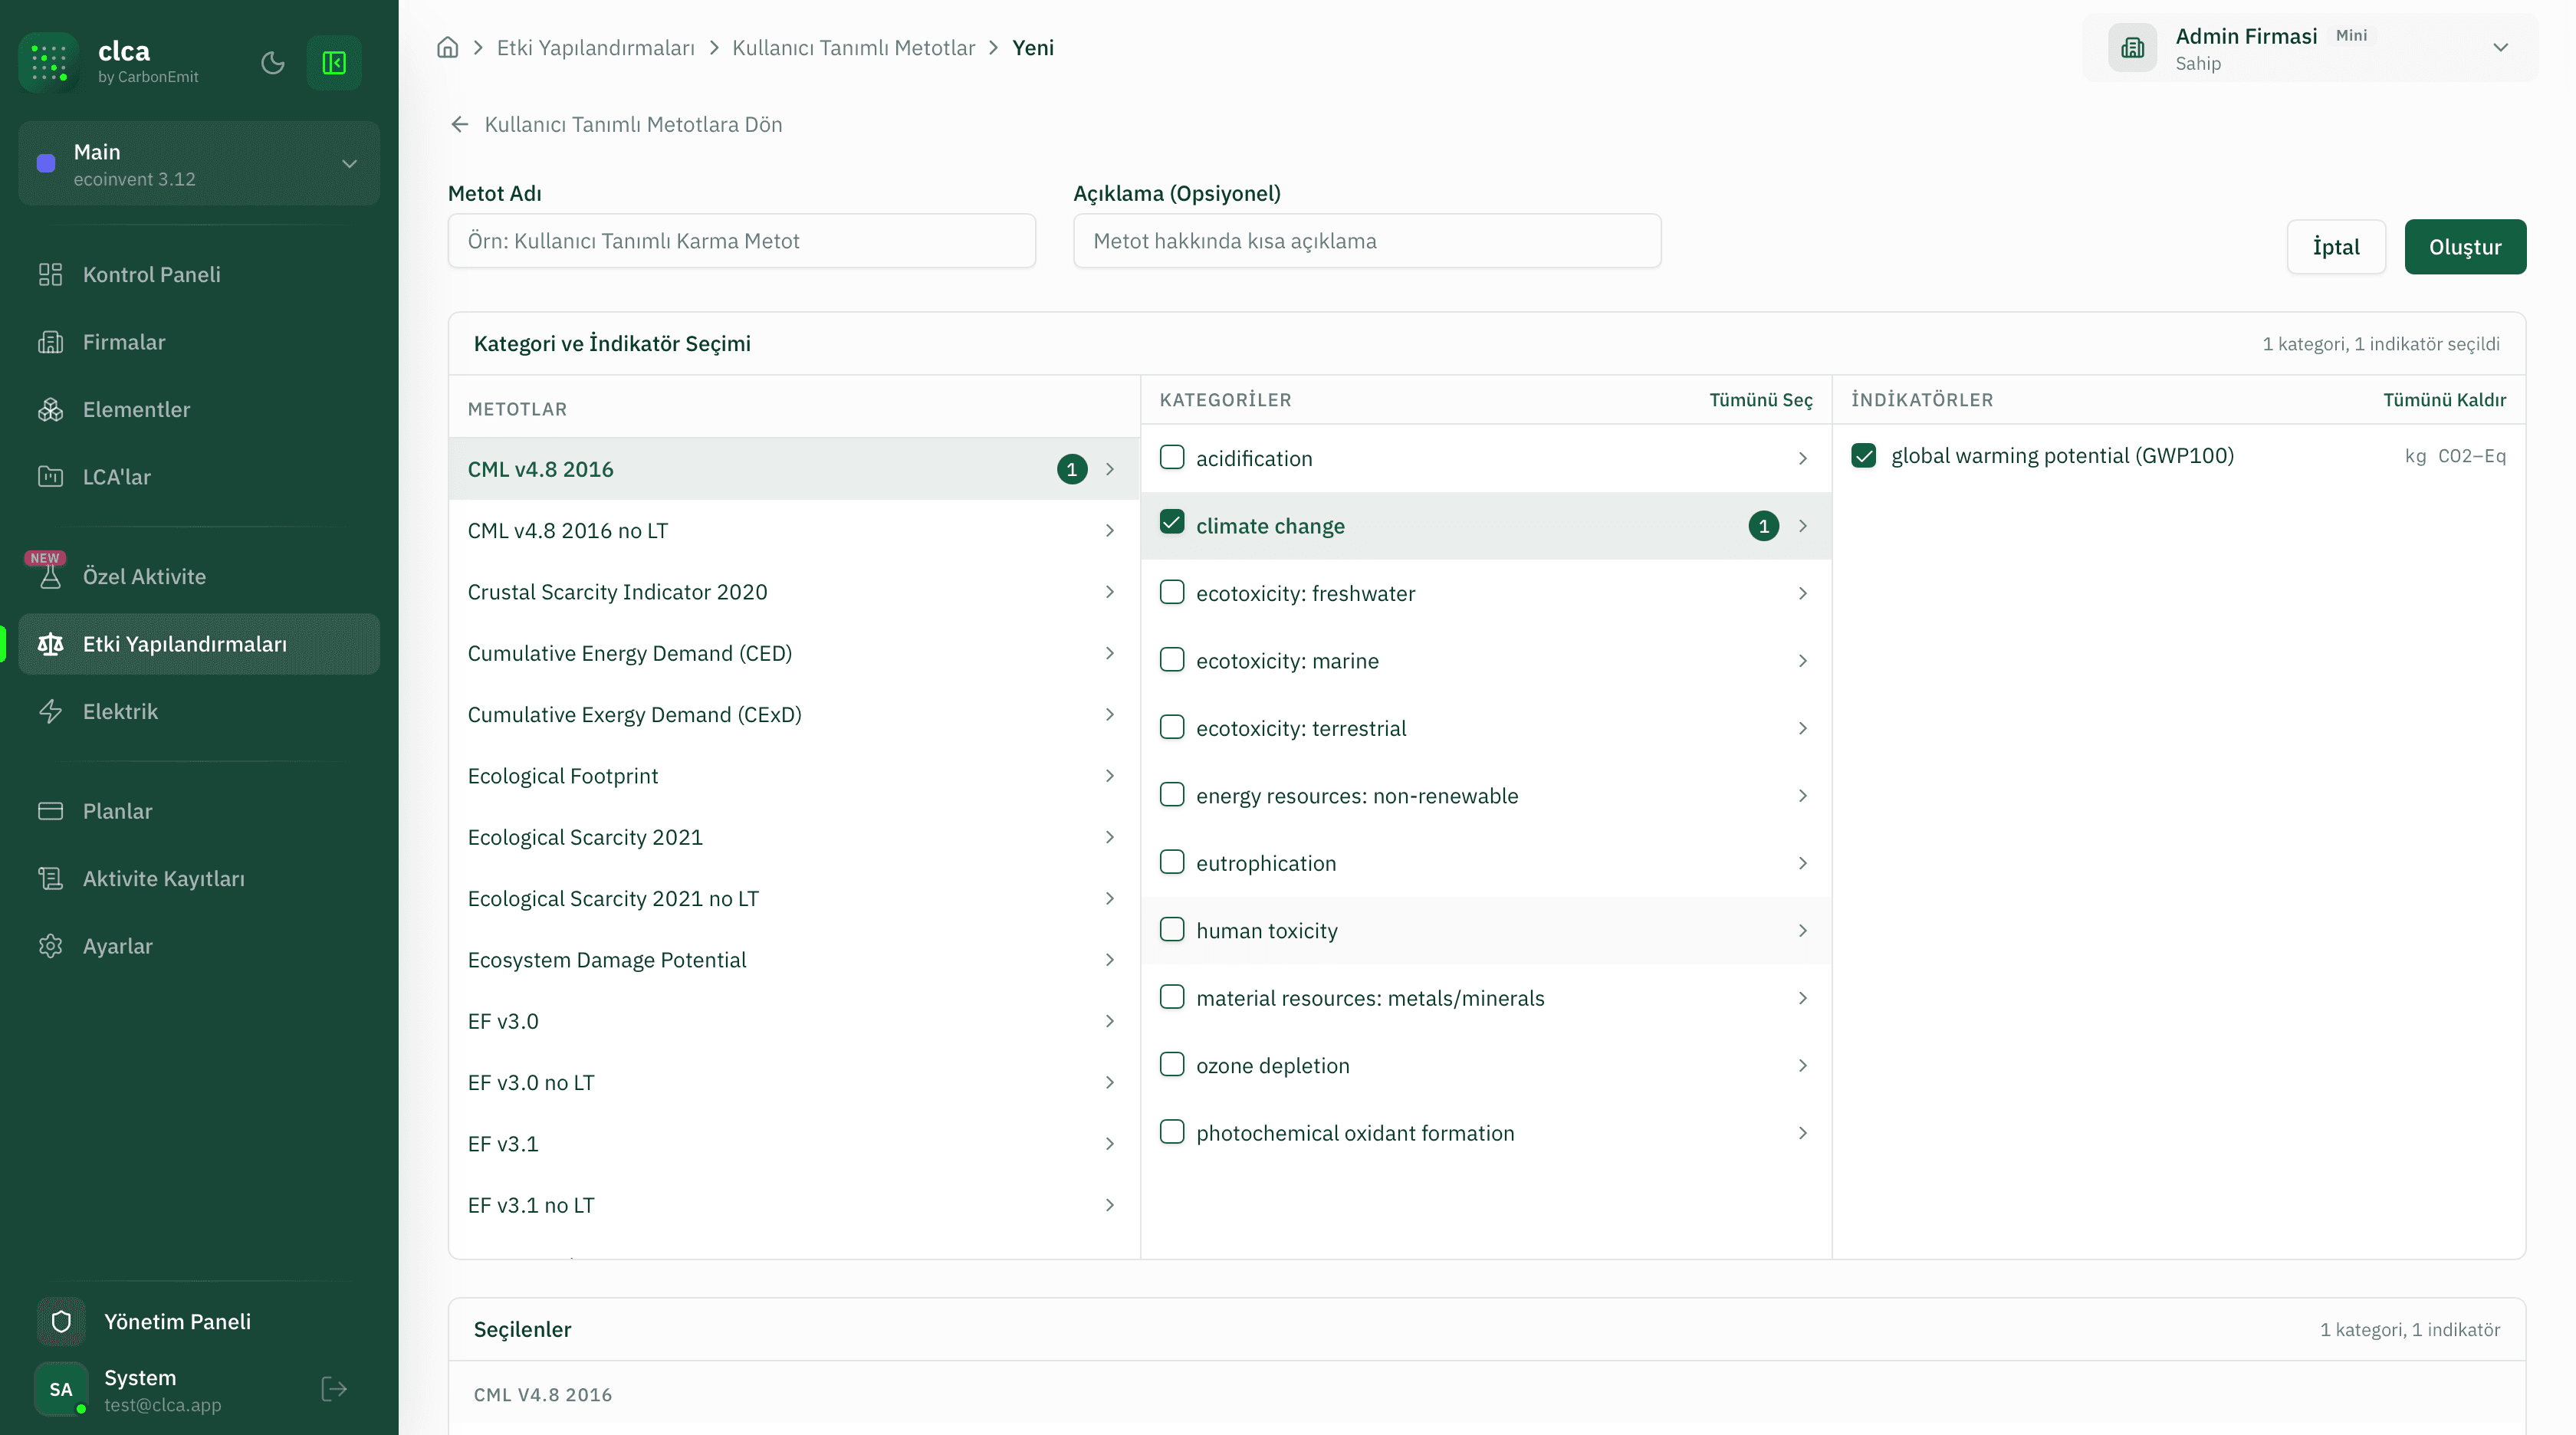
Custom Method — Category and Indicator Selection
Impact Configurations > Custom Methods > New lets users build a custom method by starting from standard LCIA methods (CML, EF, CED). The left panel lists methods, the middle shows categories and the right filters the matching characterisation indicators in a two-step multi-select; the footer counter transparently shows which combination will be saved.
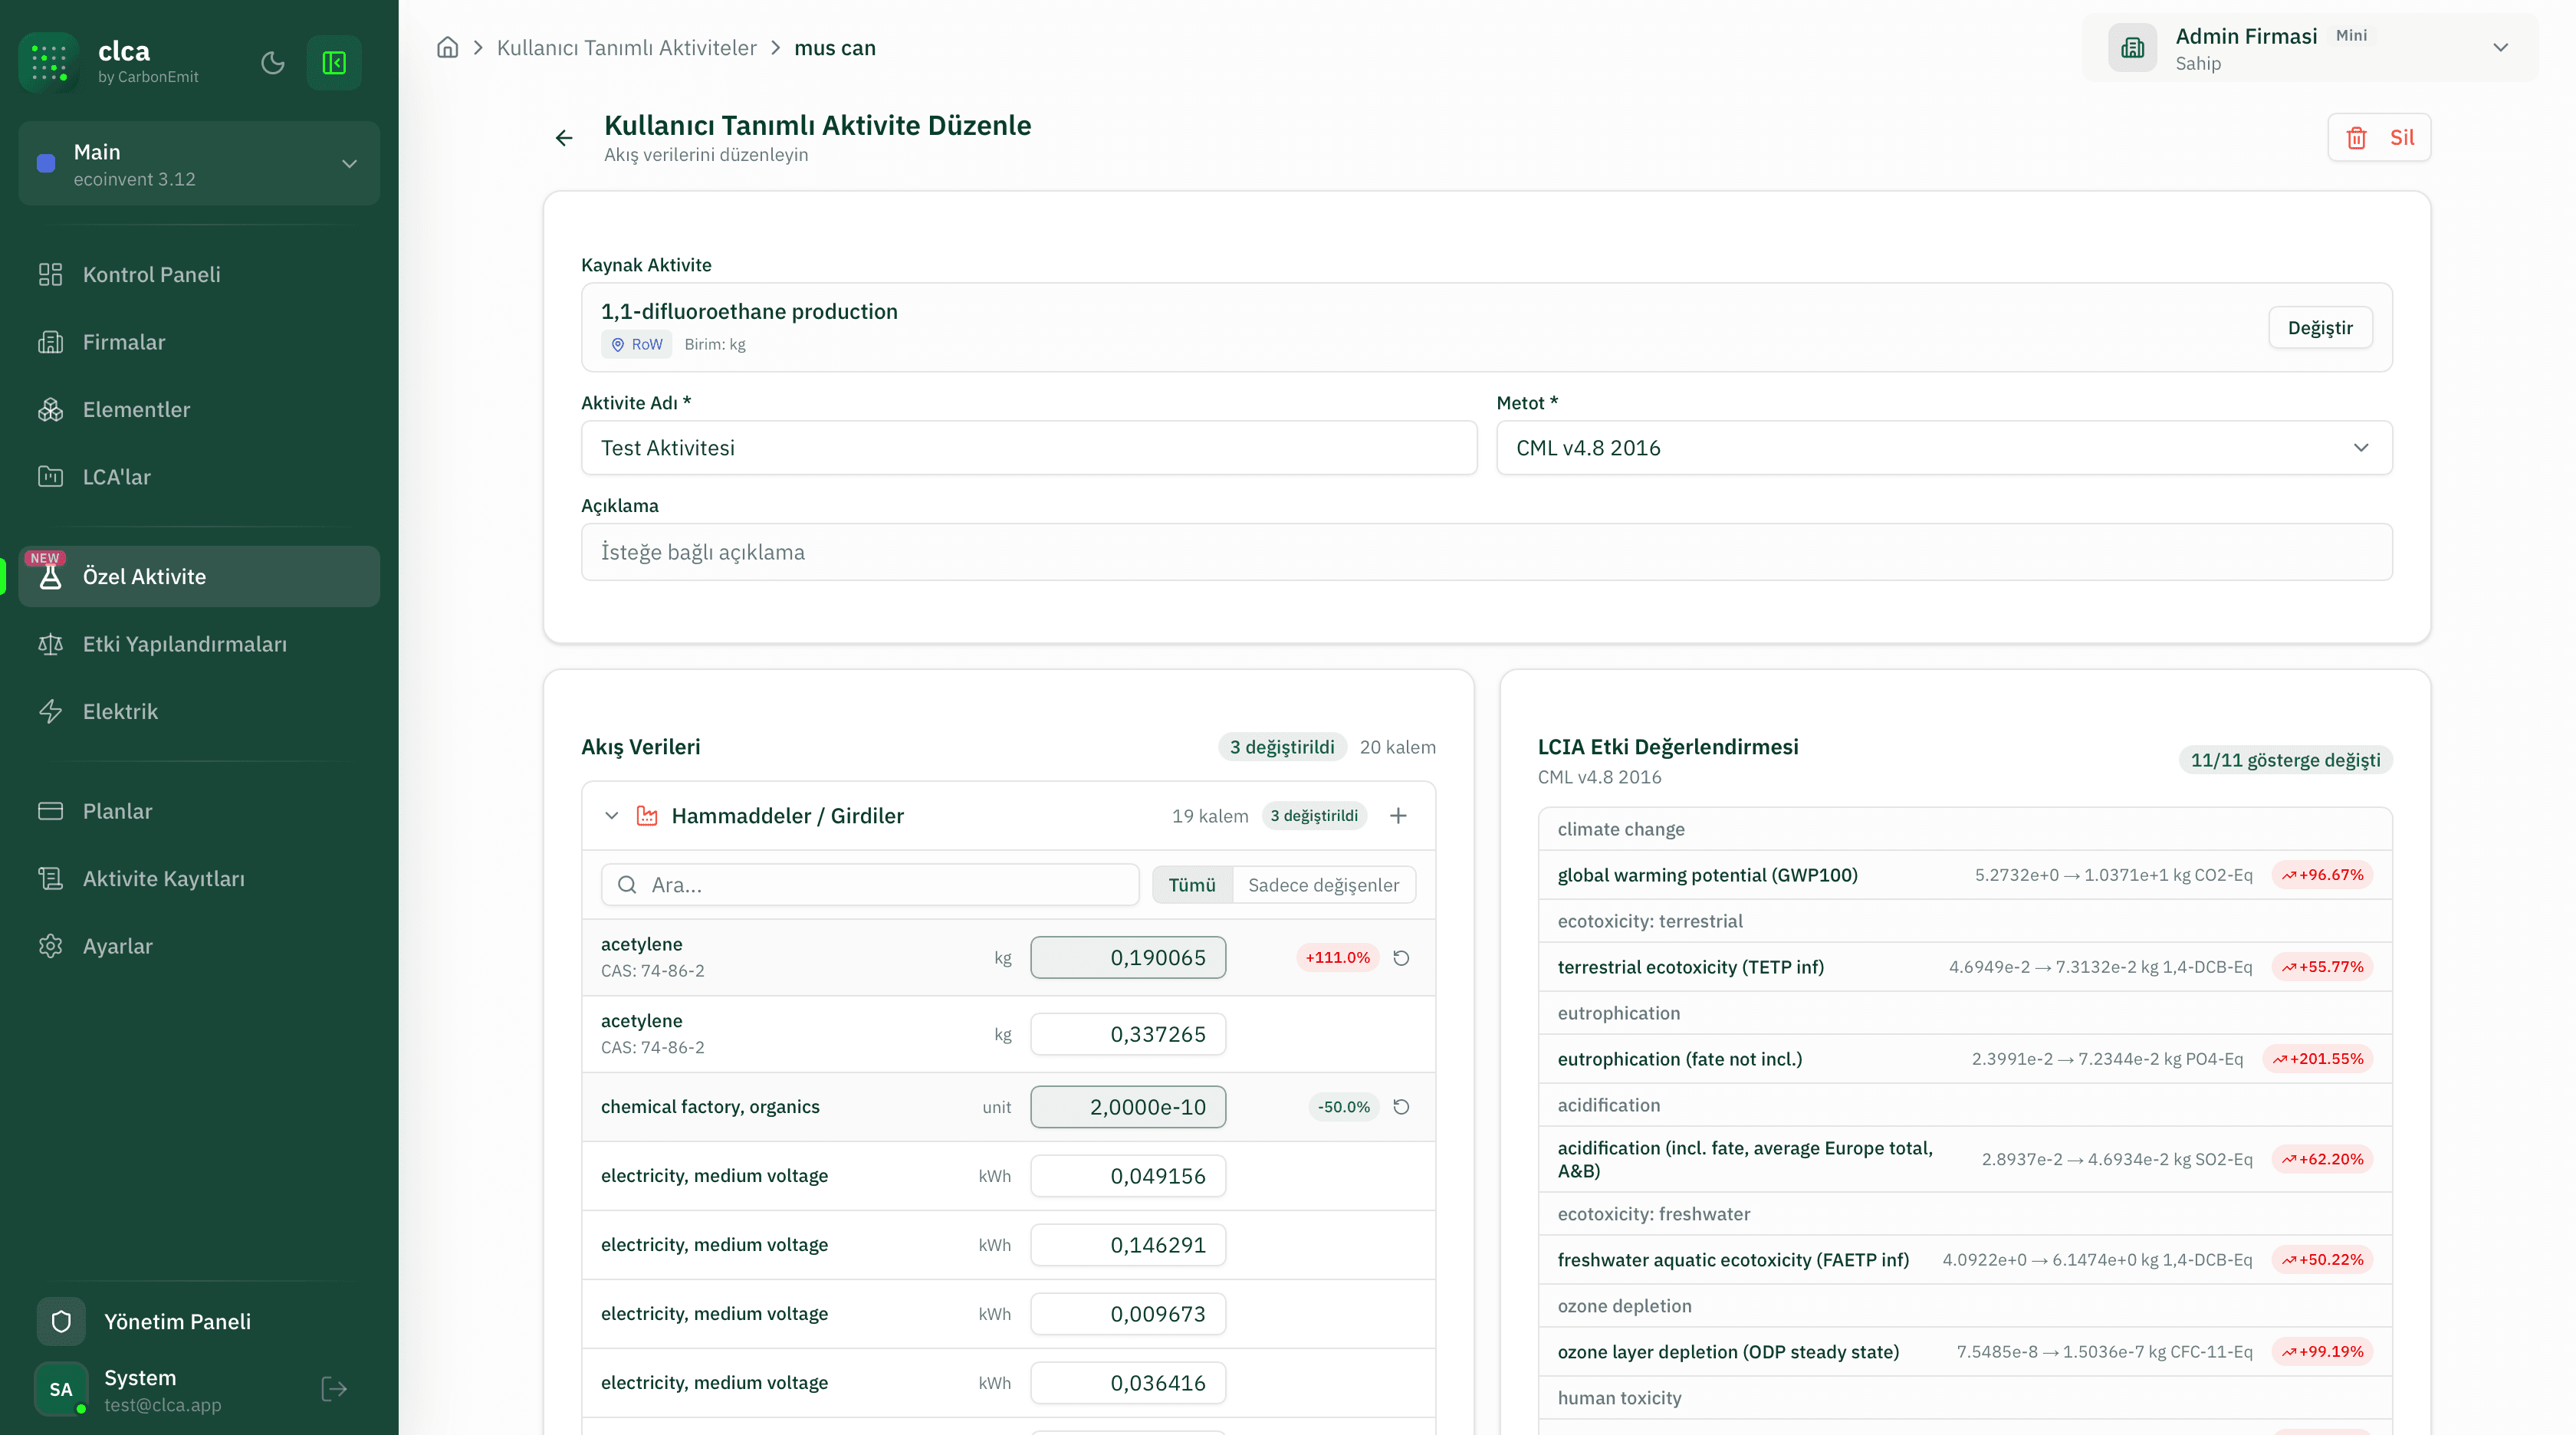
Custom Activity — Flow Data and LCIA Characterisation
Impact Configurations > Custom Activities lets you edit every flow of a custom activity derived from an ecoinvent activity in a single table. The right panel shows live LCIA deltas (green/red percentages) for the same activity's indicators (climate change, ecotoxicity, eutrophication, acidification...), exposing the real-time impact of every change.
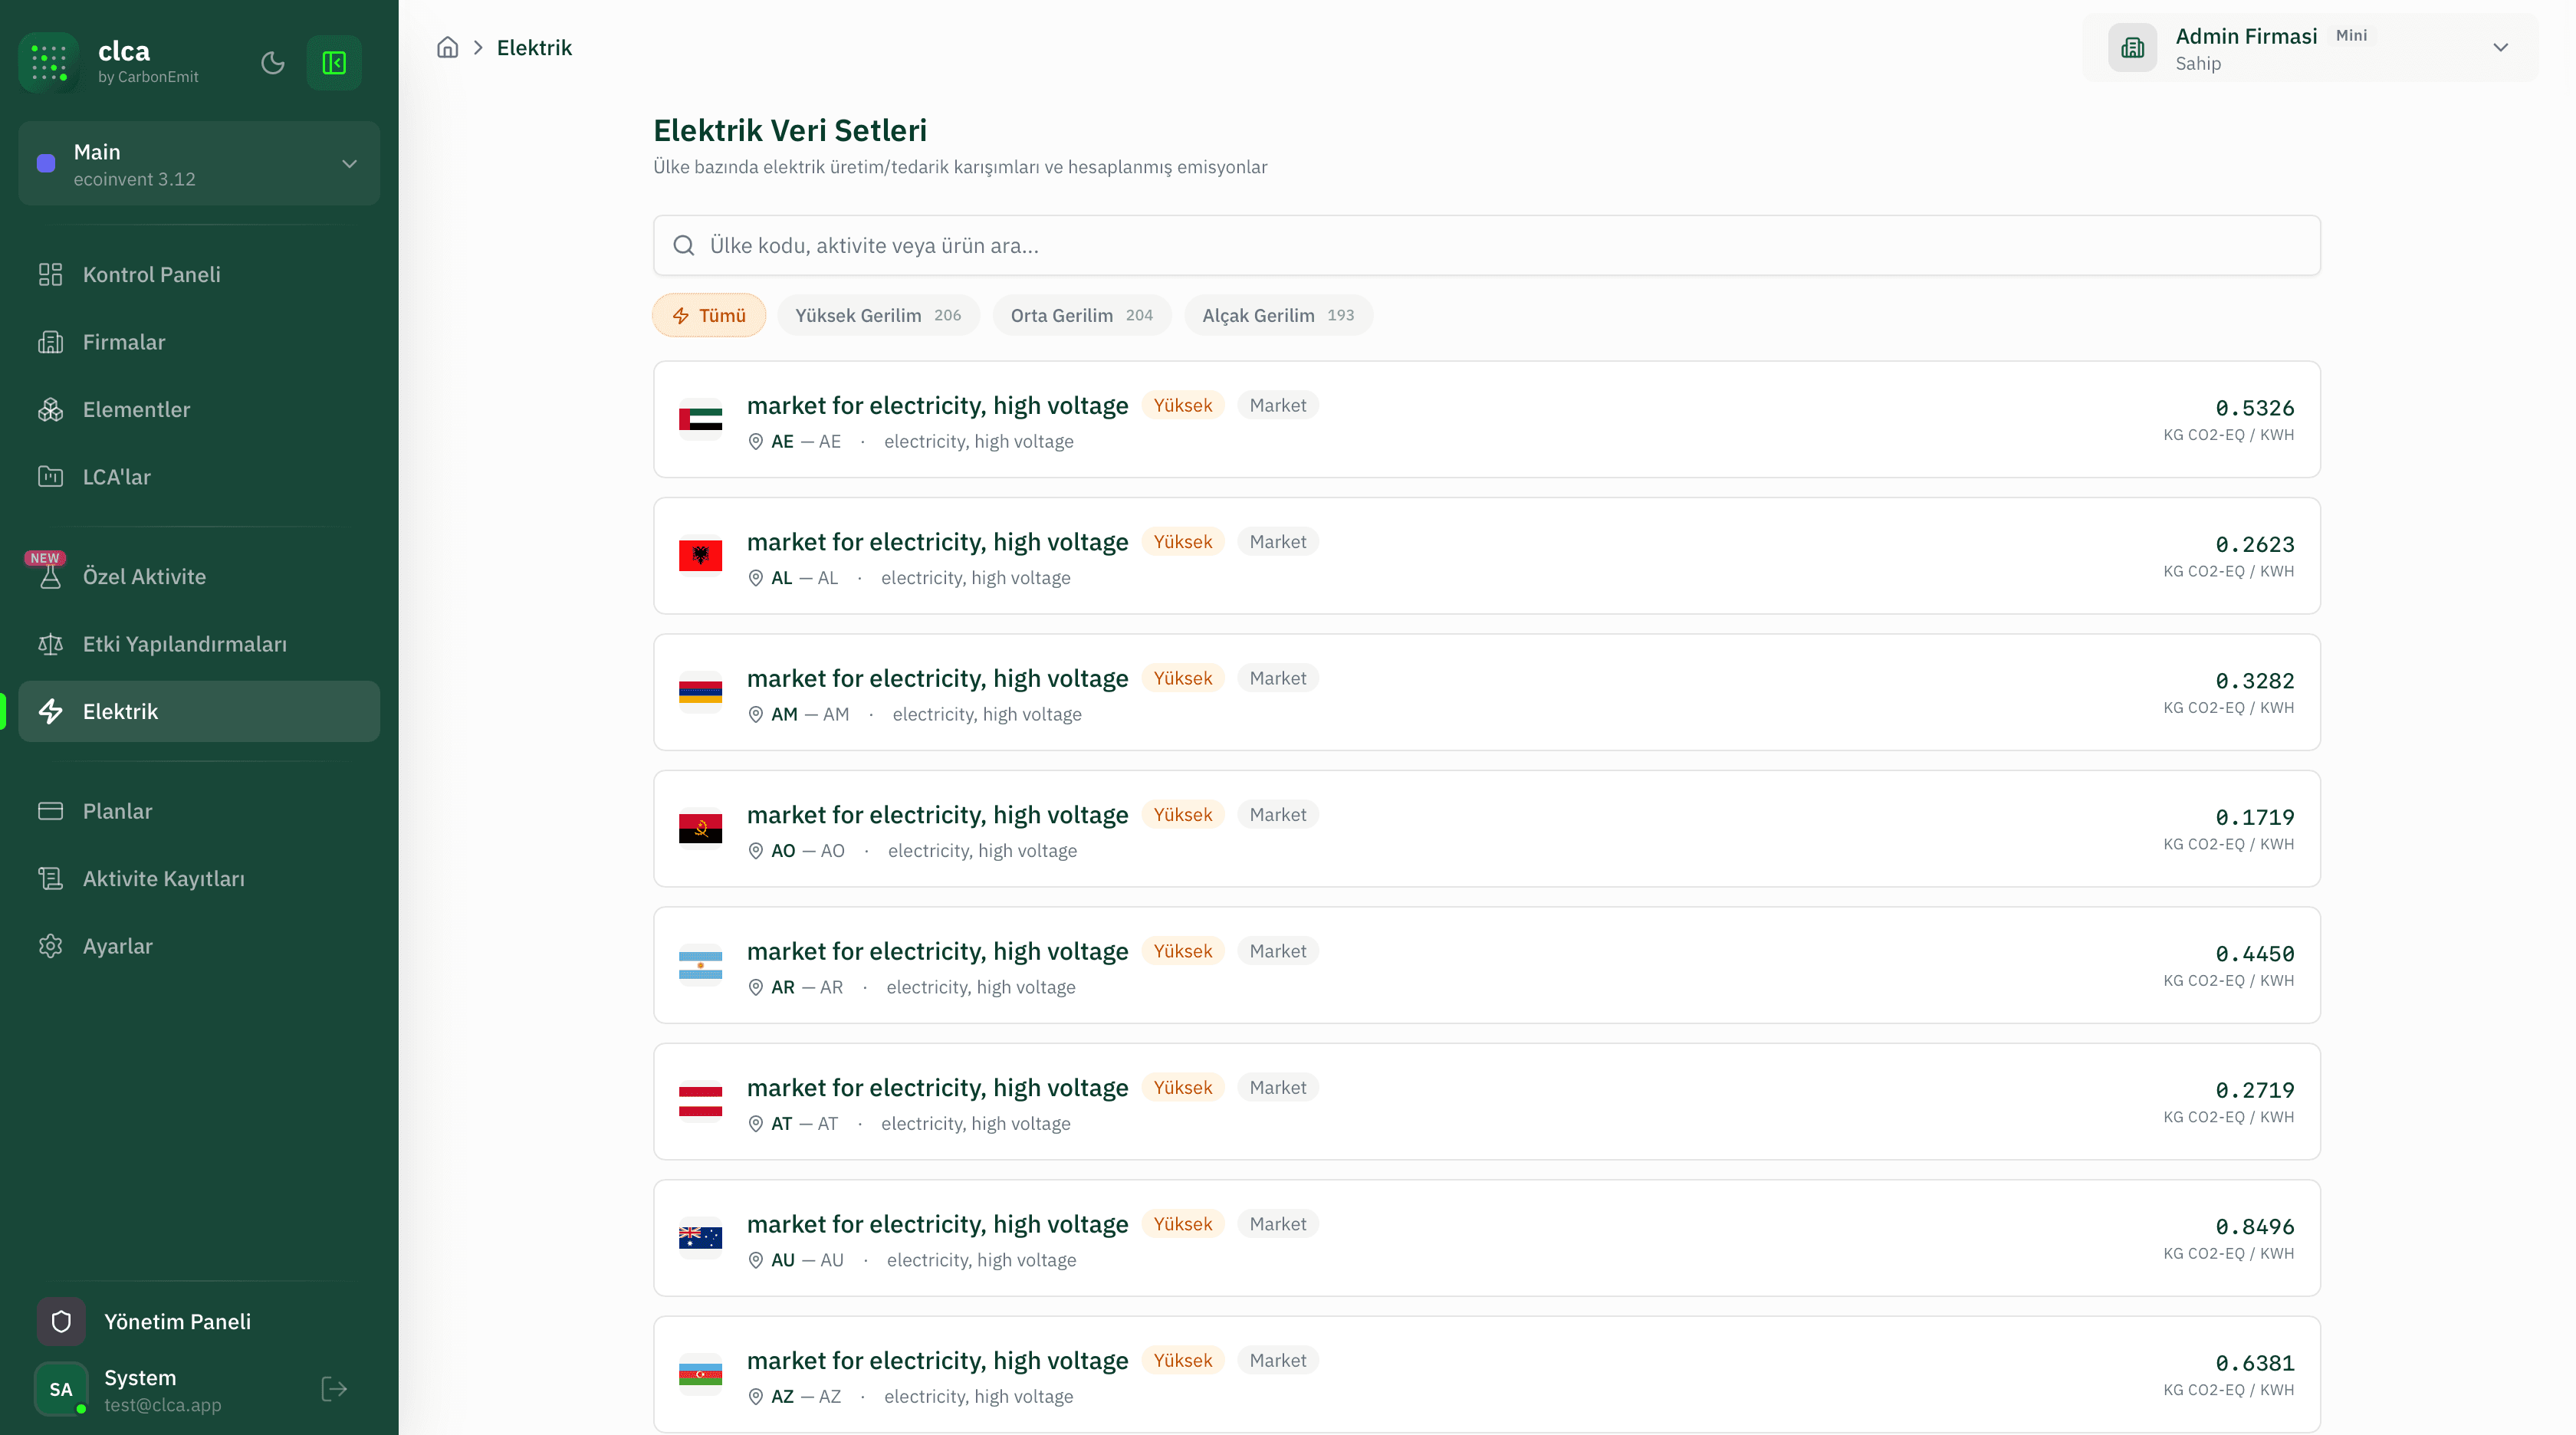
Electricity Datasets — Country-level Emission Factors
The Electricity Datasets module lists ecoinvent-based country electricity generation/supply mixes and their pre-computed emission factors (kg CO2-eq/kWh) by voltage level (high/medium/low). Search and filters make it quick to pick the right country mix and attach it to the inventory.
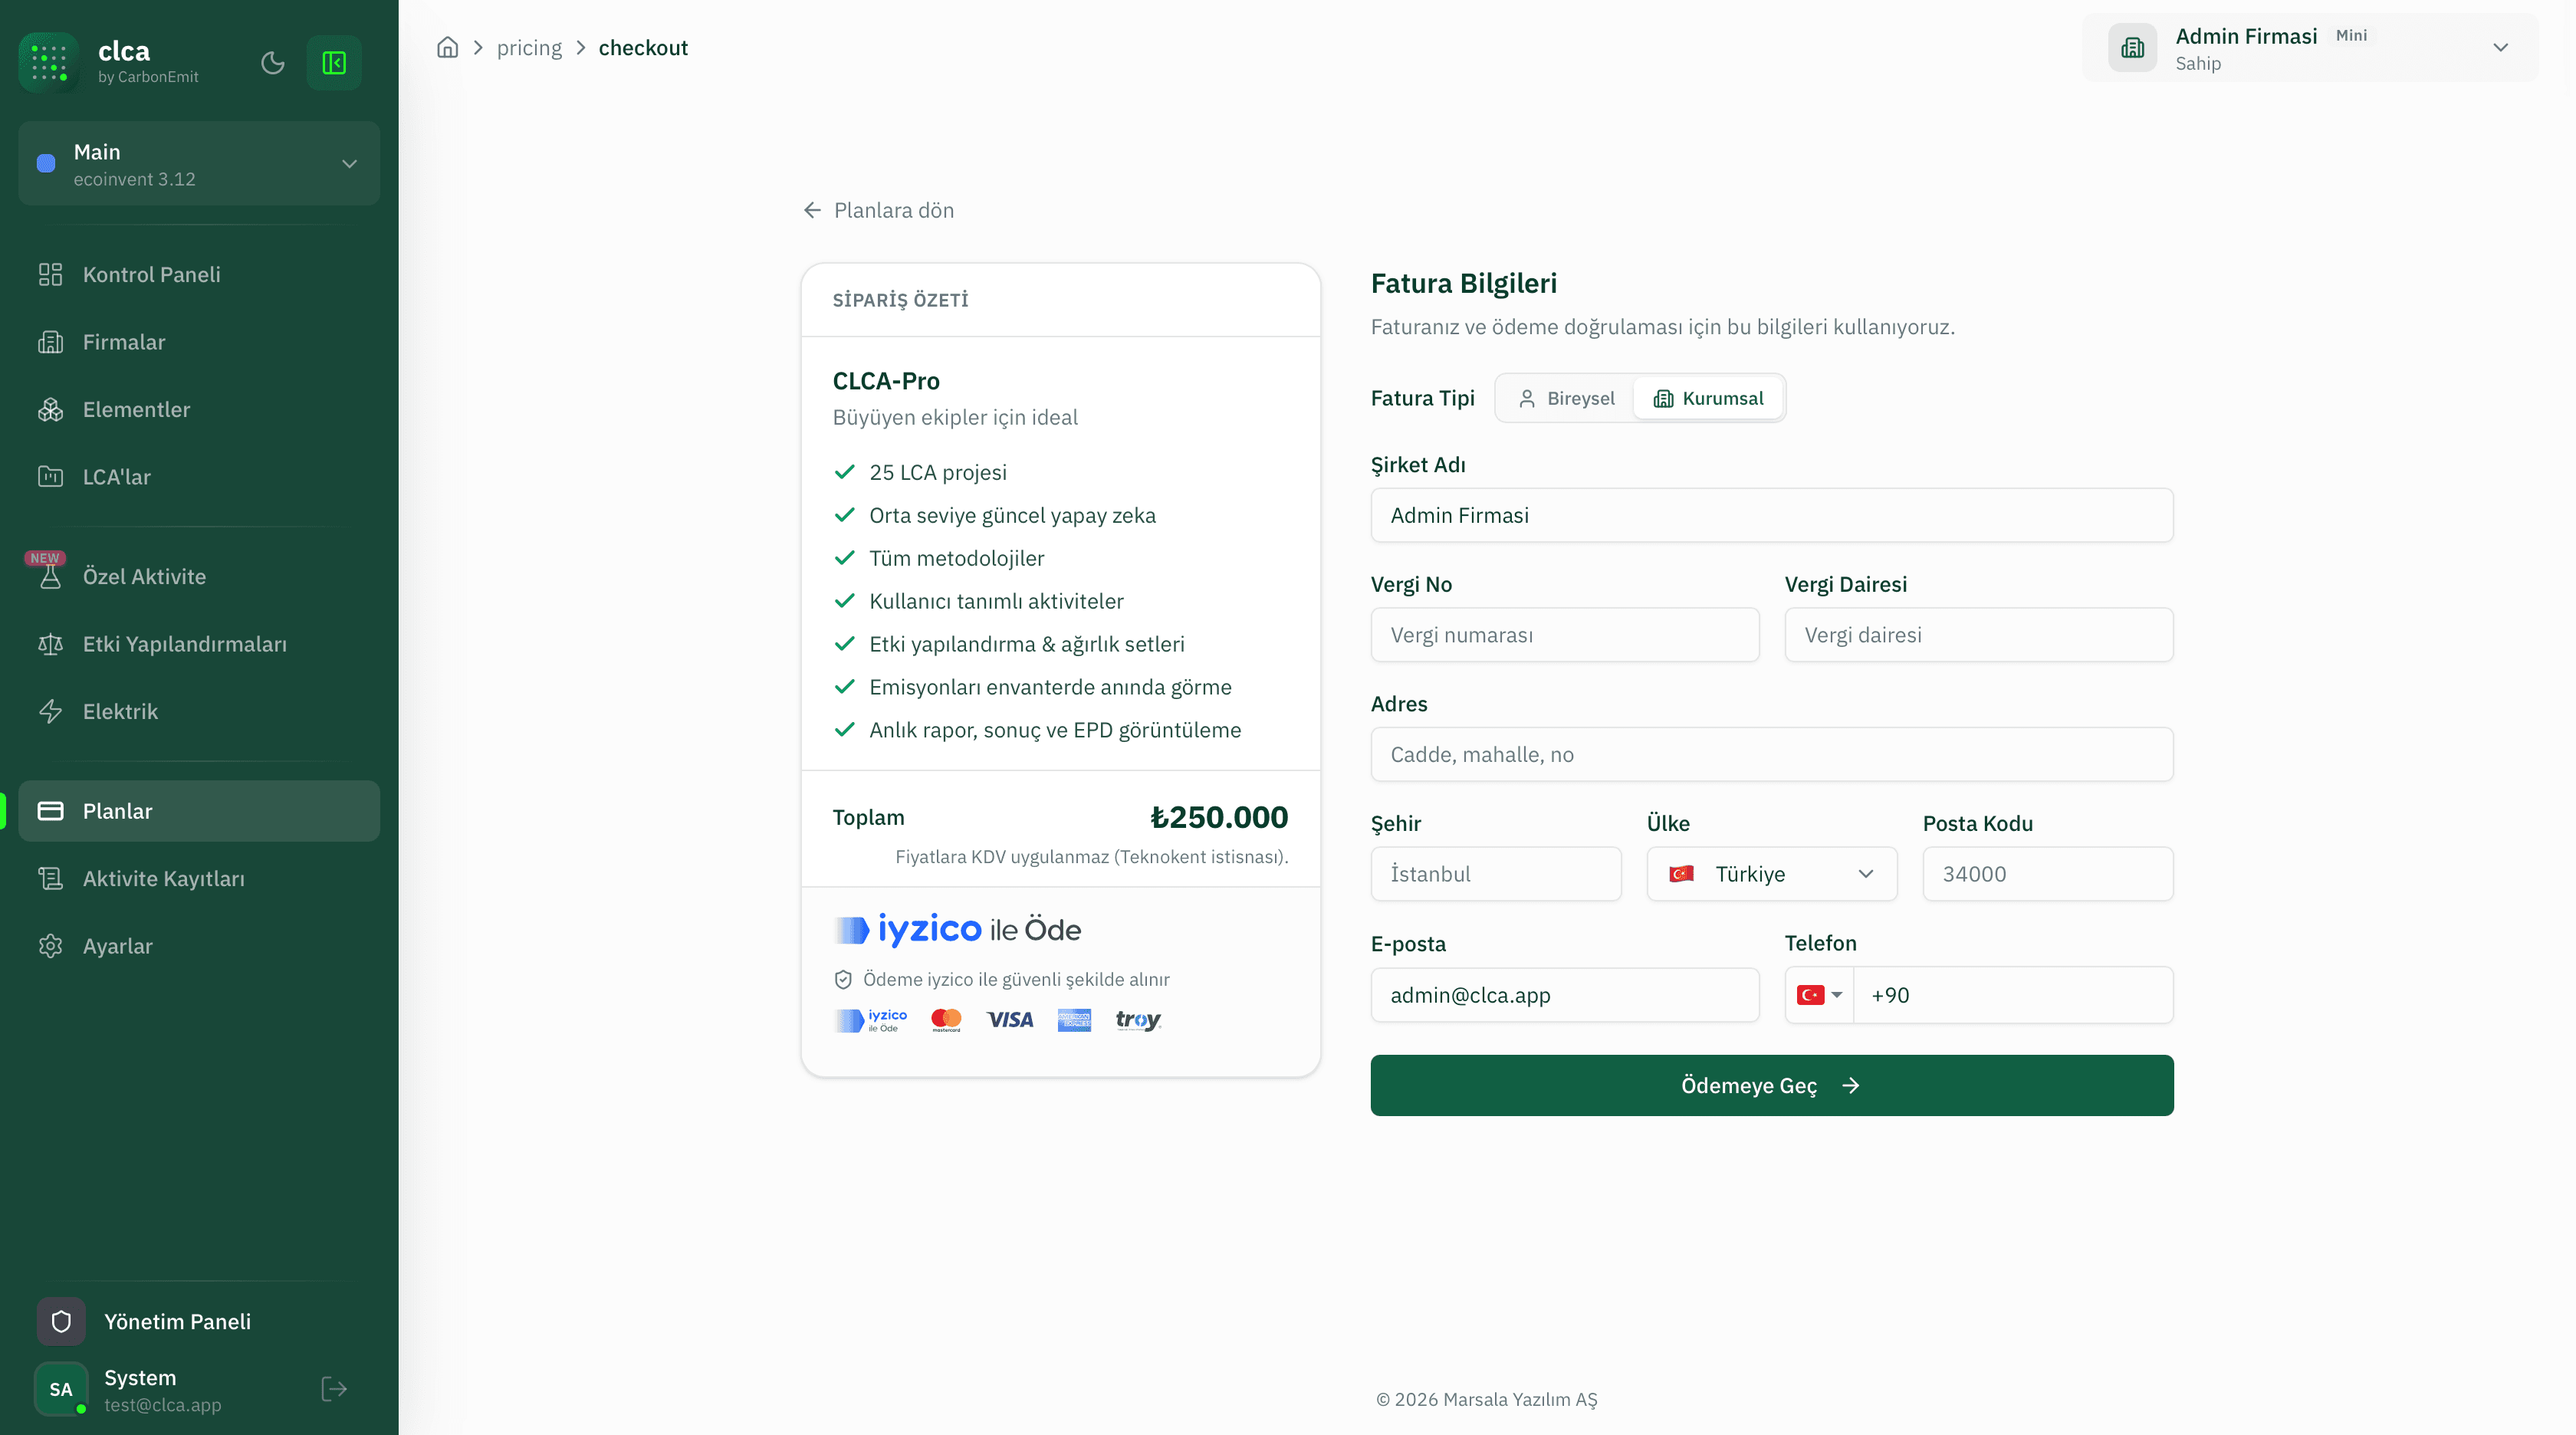
Plans — Order Summary and Tosla Checkout
Plans > Checkout shows the selected subscription's contents (e.g. CLCA-Pro) and VAT-inclusive total in an order summary. Individual/Corporate billing details are collected and payment is taken securely through Tosla.