Recovery credits by material: from PET to aluminium
A tonne of recovered aluminium and a tonne of paper do not earn the same credit. The primary and secondary route, the order of magnitude of the credit and the specific trap for each of six materials.
By clca Editorial TeamLast updated
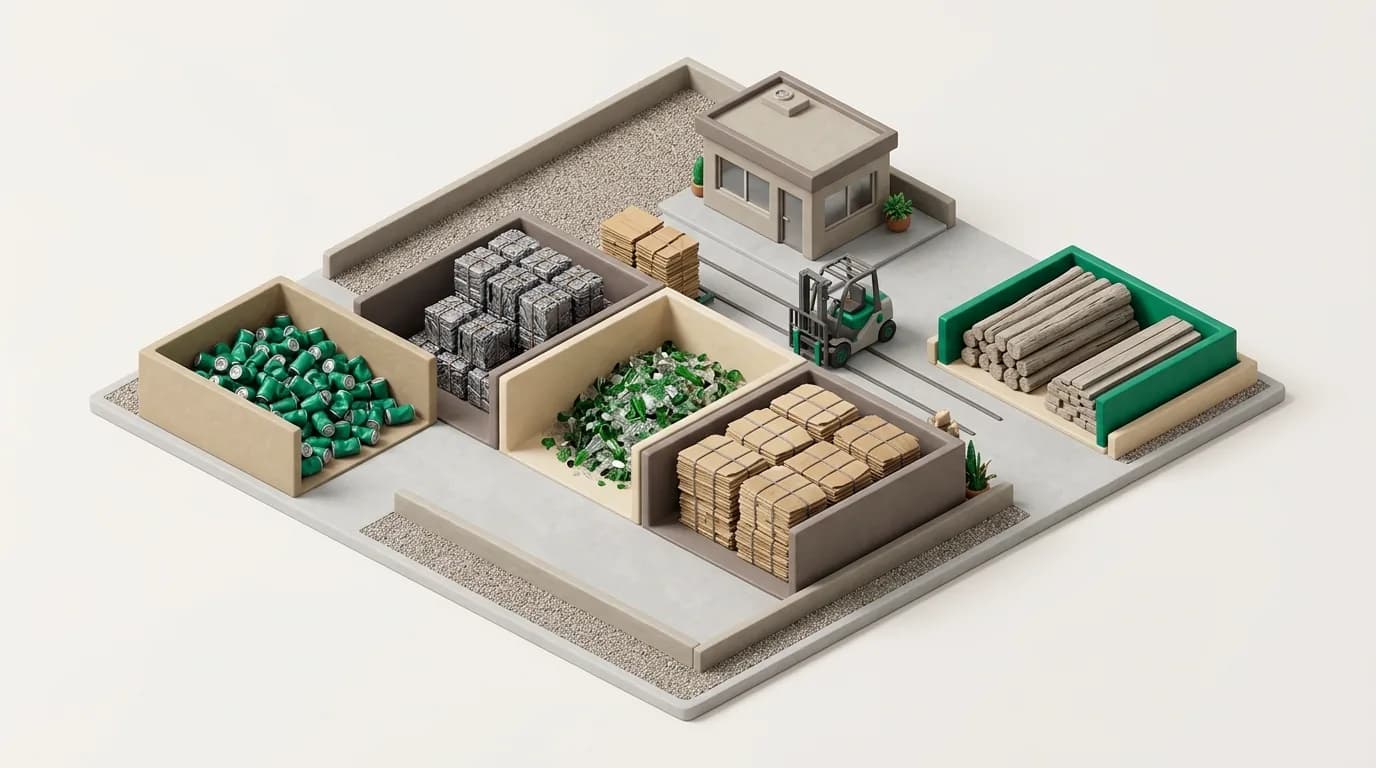
A recovery credit varies by two orders of magnitude between materials: a kilogram of aluminium scrap can earn a CO₂e credit above ten kilograms, while a kilogram of mixed paper can come out close to zero, or even negative, in terms of material substitution. The difference depends on how energy-intensive the primary route is and how much of that energy the secondary route bypasses. This article takes six common waste streams — PET, packaging glass, paper and board, steel, aluminium and wood — through the same template: which virgin product is displaced, what the secondary route is, the order of magnitude of the credit, and which trap breaks the calculation. The limits of proxy data for textiles and electronic waste are covered separately. All ranges given are based on ecoinvent 3.12 cut-off and vary with plant, grid and input quality.
Aluminium: the largest credit, the largest concentration risk
Primary aluminium consumes 13–15 MWh of electricity per tonne because of Hall-Héroult electrolysis; in the global market mix the footprint of primary ingot sits roughly in the 8–17 kg CO₂e/kg range and depends almost entirely on the source of that electricity. The secondary route — remelting post-consumer scrap — bypasses electrolysis completely and stays below 1 kg CO₂e per kilogram. With a yield of 0.991 it is the highest-yield material. The result is a credit of roughly 10 kg CO₂e per kilogram and above: five times that of the same mass of PET, tens of times that of paper. That is also where the trap lies: aluminium, even when small in tonnage within a mixed waste portfolio, can generate more than half of the total credit. If one stream exceeds 50 per cent of a balance, the report must show it explicitly, and the source and quality of the aluminium scrap (single alloy or mixed) must be documented.
Steel: a credit that depends on the grid factor
For steel the primary route is the blast furnace and converter (BF-BOF), carrying roughly 1.8–2.3 kg CO₂e per kilogram; the secondary route is the electric arc furnace (EAF), at around 0.4–0.7 kg CO₂e/kg on the European grid. Yield is moderate at 0.884. The net credit comes out in the 1–1.8 kg CO₂e/kg range — a tenth of aluminium's, but because steel tonnage is usually far larger its absolute share of a portfolio matters. The trap is the electricity intensity of the EAF: at roughly 0.55 kWh of electricity per kilogram of steel, the secondary factor is sensitive to the destination country's grid. If the grid factor is above the European reference (about 0.36 kg CO₂e/kWh) the secondary factor rises and the credit narrows; for the Turkish grid this correction is of the order of a few hundred grams per kilogram. Where the destination of the scrap is known, the secondary activity should be corrected to that country's grid.
PET: a clean pair, a quality-dependent substitution
PET is one of the few plastics with both a virgin and a recycled bottle-grade granulate activity in ecoinvent, so the factor pair is clean. Virgin granulate sits at roughly 2.5–3.2 kg CO₂e/kg, recycled granulate — including sorting, washing and extrusion — in the 0.5–1.1 kg CO₂e/kg range. At 0.823 the yield is lower than for the other materials: label, cap, PVC contamination and washing losses are significant. The net credit is roughly 1.5–2.5 kg CO₂e per kilogram. The trap is in the substitution ratio: for bottle-to-bottle (food-contact) recycling 1.0 is defensible; for PET going into fibre or strapping the displaced product is different and the quality drop pulls the ratio below 1. Sorted, baled PET and a mixed-plastics bale are not the same stream; mixed plastics need a proxy dataset and a low confidence grade.
Glass: low unit credit, marginal derivation
For glass the credit per kilogram is small — roughly 0.3–0.6 kg CO₂e per kilogram of cullet — because glass making is already a furnace-energy-bound, high-melting-temperature process and cullet only reduces batch preparation and part of the furnace energy. The industry's rule of thumb is that every 10 per cent increase in cullet in the furnace charge lowers energy consumption by 2.5–3 per cent; the process CO₂ from calcining carbonates (soda ash, limestone) is also eliminated. The calculation method differs from the others: ecoinvent has no separate secondary glass activity made from cullet; production is defined by cullet share. The credit is derived by dividing the difference between production without cullet and with cullet (roughly 60 per cent share) by the cullet share. Yield is 0.926. The trap is colour and contamination: mixed-colour cullet can only go into green or amber glass, and the product it displaces is not white glass.
Paper and board: material credit near zero, benefit elsewhere
Paper is the material that runs most against intuition. Virgin containerboard (kraftliner) is made by the kraft process, which draws most of its process energy from burning black liquor — biomass — so its fossil footprint is relatively low. Testliner made from recovered fibre, by contrast, draws its drying energy mostly from natural gas and grid electricity. The result is that the primary and secondary factors sit close together, and depending on the plant mix the gap can shrink to zero or even change sign: the material substitution credit can be negative. Yield is high at 0.941, but a high yield does not change the result when the multiplier is small. The real climate benefit of paper recovery lies in avoiding the methane that would form in landfill; that is an avoided-disposal credit rather than a material substitution, and it can only be reported in a separate scenario when a counterfactual disposal route is defined in the baseline. On the energy side, total CED is especially misleading for paper: the biomass energy of the wood looks like a saving. The headline figure must be non-renewable CED.
Wood, textiles and electronic waste: streams that need care
Wood: biogenic carbon and dry mass
Post-consumer wood (pallets, construction timber, furniture) is chipped and goes into particleboard production or fuel. In the material route the displaced product is virgin wood chips; both routes have a low fossil footprint (of the order of tens of grams per kilogram), so the GWP credit per kilogram is small. Wood's real carbon story is biogenic: the carbon in the product was taken from the forest and stays in storage as long as the product stays in the loop. The variant of IPCC 2021 GWP100 that excludes biogenic CO₂ counts that storage neither as a credit nor as a burden; this is the right choice for a recovery balance, because otherwise every tonne of wood would carry a false credit of 1.8 tonnes of CO₂. Yield is 0.80 on a dry-mass basis, and 20–40 per cent moisture is typical for wet wood; skipping the moisture correction inflates the credit by the same proportion. The trap is that painted or impregnated wood is not suitable for the material route; that stream goes to energy recovery and is subject to a different calculation.
Textiles and electronic waste: the limits of proxy data
For two streams there is no genuine recovery route in ecoinvent. For mixed textiles, recycled polyester pellet is used as a proxy for mechanical fibre recovery; the yield of 0.70 is an assumption and confidence is low. For electronic waste (WEEE) the credit is calculated only for the iron and aluminium fractions after mechanical separation; copper, precious metals and plastics are left out, so the result is a lower bound. Both streams must be presented in the report with a mandatory caveat, and their share of the total credit shown separately. Presenting a credit calculated with proxy data as if it were verified lowers the credibility of the whole balance.
Order of magnitude and reading the portfolio
- Aluminium scrap — roughly 10 kg CO₂e per kilogram and above; dominates the portfolio even at small tonnage
- Steel scrap — 1–1.8 kg CO₂e/kg; large tonnage, grid correction essential
- PET (sorted) — 1.5–2.5 kg CO₂e/kg; substitution ratio depends on the application
- Packaging glass — 0.3–0.6 kg CO₂e/kg of cullet; low unit, high volume, colour separation matters
- Paper and board — material credit near zero or negative; benefit lies in avoided landfill
- Wood — small fossil credit; biogenic carbon excluded, dry mass is the basis
- Textiles and WEEE — proxy data, low confidence, lower bound; reported with a caveat
A portfolio is read with two questions. First: where does the credit come from? If more than half of the total comes from a single stream, that stream's mass, yield and factor pair must be documented far more rigorously than the rest; that is exactly why the concentration warning exists. Second: which streams are large in tonnage but small in credit? Those streams (paper, glass) are valuable not in the climate claim but in the waste hierarchy and landfill-diversion narrative; the balance does not belittle them, it puts them in the right place.
Frequently asked questions
- Which waste material earns the highest recovery credit?
- Aluminium. Primary production is extremely energy-intensive because of electrolysis, and the secondary route bypasses it entirely; the credit per kilogram can reach roughly 10 kg CO₂e and above. That is why, in a mixed portfolio, aluminium can generate more than half of the total credit even at a small tonnage.
- Why can the credit for paper recycling be low or negative?
- Virgin kraft paper draws most of its energy from biomass by burning black liquor and has a low fossil footprint; testliner made from recovered fibre uses natural gas and grid electricity. The two factors sit close together and the gap can shrink to zero. Paper's real benefit is the methane avoided at the landfill.
- Why does the credit for steel scrap vary by country?
- The secondary route, the electric arc furnace, consumes roughly 0.55 kWh of electricity per kilogram of steel. If the grid factor is higher than the European reference, the secondary factor rises and the credit narrows; that is why the correction is made with the grid of the country the scrap goes to.
- Does biogenic carbon count as a credit in wood recovery?
- No. A recovery balance uses the variant of IPCC 2021 GWP100 that excludes biogenic CO₂; the carbon inside the wood enters neither as a credit nor as a burden. Otherwise every tonne of wood would carry a false credit of 1.8 tonnes of CO₂. The credit comes only from the fossil footprint of the displaced virgin chips.
- Can a credit be calculated for textiles and electronic waste?
- It can, but with proxy data and low confidence. For textiles, recycled polyester pellet is the proxy for mechanical fibre recovery; for electronic waste only the iron and aluminium fractions are counted and the result is a lower bound. Both streams are presented in the report with a mandatory caveat.
Tags
- recovery
- recycling credit
- aluminium LCA
- steel recycling LCA
- glass LCA
- paper LCA
- waste management
- circular economy
Related reading
All articles in Data & Methods- Data & Methods
Recovery of organic waste: compost, biogas and open dumping
Organic waste substitutes no product; the credit comes entirely from avoided methane. Open dumping, landfill, composting and biogas compared on ecoinvent 3.12 data.
12 min read - Data & Methods
Recovery calculation: how to quantify avoided CO₂e and energy
A recovery calculation measures how much greenhouse gas and primary energy is avoided compared with the scenario in which a waste stream is not recovered. The formula, the four inputs and a worked 100-tonne PET example.
11 min read - Data & Methods
Energy recovery or material recycling? Comparing the credits
The same tonne of plastic displaces electricity if burned and granulate if recycled — but the two credits are not the same size and cannot both be granted to one stream. The waste hierarchy, EN 15804 Table 13 and the formulae.
11 min read - Data & Methods
Recovery yield and substitution ratio: product per kg of waste
The two quiet multipliers of a recovery credit: yield, which describes process loss, and the substitution ratio, which describes quality. Catalogue yields by material, the moisture correction and downcycling.
10 min read