Transport in LCA (A4): tkm, load factor and empty return
A4 is the transport of the product from factory gate to site, calculated as mass × distance × a per-tkm factor. Vehicle class, utilisation, empty return and the trap of volume-limited products; the EN 15804 scenario table and a worked example.
By clca Editorial TeamLast updated
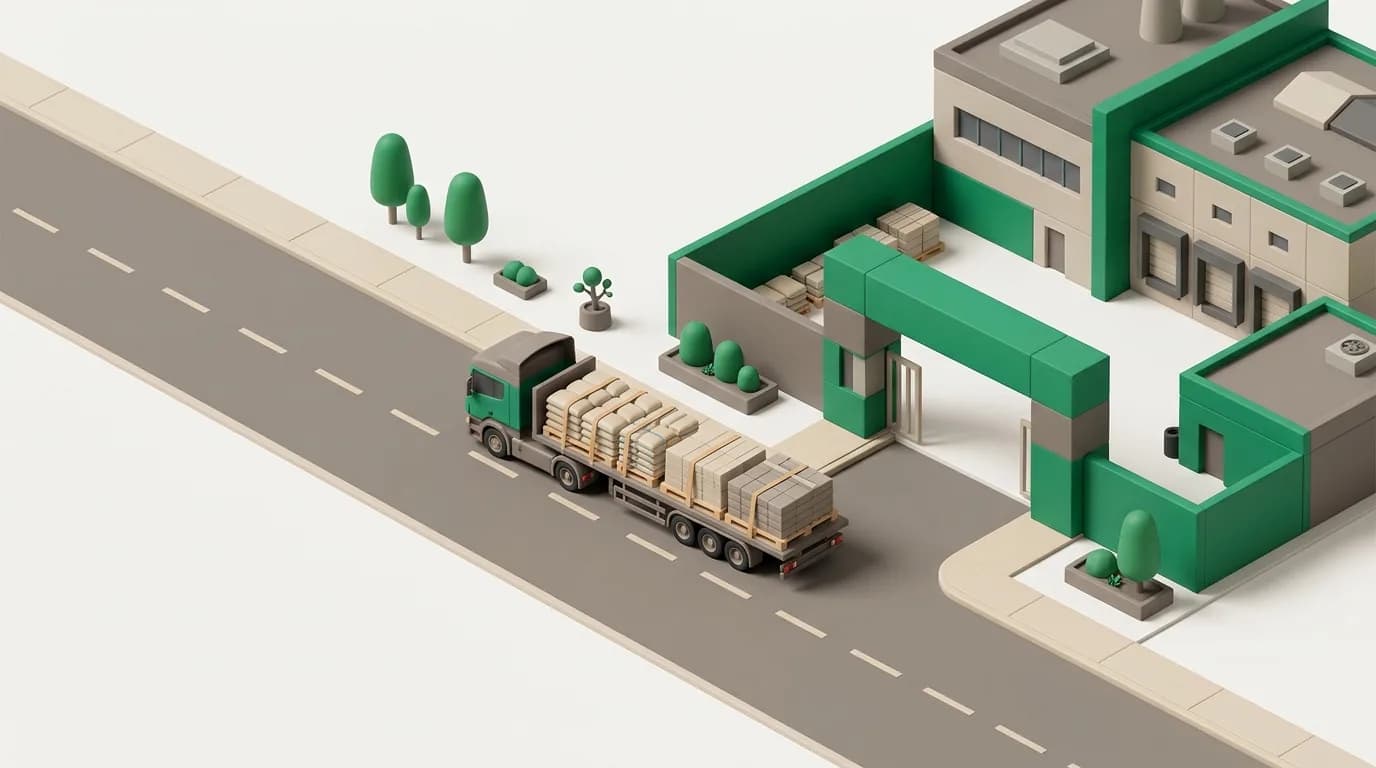
Module A4 is the transport of the finished product from the factory gate to the site where it will be used, and its emissions are the product of three numbers: the mass transported (tonnes), the distance (km) and the vehicle type's emission factor per tonne-kilometre (kg CO₂e/tkm). For heavy products moved short distances A4 is a small share of the total; for aggregates, precast elements or imported products it can approach A1–A3, or exceed it. The arithmetic is simple, but four decisions change the result several-fold: which vehicle class, which utilisation rate, whether the empty return is counted, and whether the product is mass-limited or volume-limited. EN 15804 requires each of these decisions to be declared in the A4 scenario table; this article explains the calculation needed to fill that table correctly.
A2 versus A4: where does the manufacturer's control end?
A2 is the transport of raw materials from supplier to factory and sits inside the product stage (A1–A3): distances and vehicles are known from the manufacturer's purchasing records, so it is calculated with real data. A4 comes after the factory; when the EPD is prepared, nobody knows to whom or where the product will be sold. A4 is therefore a 'scenario': the manufacturer declares a typical delivery profile, and whoever performs the building LCA replaces it with the project's actual distance. Confusing the two modules has two consequences — estimating A2 like a scenario lowers the data quality of A1–A3, while presenting A4 as a fixed fact assumes the product travels the same distance to every project, which it does not.
The tkm logic: mass × distance
One tonne-kilometre is one tonne of load moved one kilometre. Moving a 24-tonne load 200 km is 4,800 tkm; the emission is that number multiplied by the vehicle type's factor. The factor takes the vehicle's fuel consumption per kilometre and divides it by average utilisation to bring it down to one tonne; in databases such as ecoinvent it also includes the share of vehicle manufacture, maintenance and road infrastructure. A hand calculation of 'diesel × fuel factor' therefore usually comes out 10–20% lower than the ecoinvent tkm factor; the two are different system boundaries and must not be mixed. The mass is always the gross transported mass: product plus pallet and packaging. One tonne of insulation board may be 1.05 tonnes with its pallet — a small difference, but recorded for consistency of the declaration.
Choosing the vehicle class and emission standard
ecoinvent classifies freight activities by gross vehicle weight: lorries of 3.5–7.5 t, 7.5–16 t, 16–32 t and over 32 t, each further split by emission standard from EURO3 to EURO6. Emissions per tonne-kilometre fall as the vehicle grows, because fuel consumption does not rise in proportion to load. As orders of magnitude, in ecoinvent 3.12-type data an articulated lorry over 32 t carries roughly 0.08–0.10, a 16–32 t lorry 0.12–0.17, a 7.5–16 t lorry 0.20–0.30 and a light commercial vehicle under 3.5 t more than 0.8 kg CO₂e/tkm. Rail and inland waterway are around 0.03–0.05, a container ship 0.01–0.02; air freight is tens of times road transport. These ranges shift with fuel mix, fleet age and database version; the exact value is read from the selected activity itself. The Euro standard affects CO₂ little and NOx and particulates a lot — for GWP the class choice matters more than the standard. For deliveries in Turkey the RER or RoW geography is used and the fleet profile is noted in the report.
Load factor and empty return
A tkm factor is derived at the average utilisation the dataset assumes, and that average already includes the empty return trips found in fleet statistics. For a product moved through a general distribution network the factor is therefore used as it is. The situation changes for deliveries where the product travels in a dedicated, fully loaded lorry that returns empty: outbound full, return zero load — average utilisation drops to 50% and the emission per tonne grows accordingly. This is why EN 15804 asks for capacity utilisation to be declared 'including empty return'. The practical approach is to scale the factor by the ratio of the dataset's utilisation to the actual utilisation; it is an approximation, because part of the fuel consumption is independent of load and an empty lorry burns fuel too. A product moved in a half-full lorry produces not twice but roughly one-and-a-half to two times the per-tkm emissions of a full one.
Volume-limited products: the A4 trap of insulation
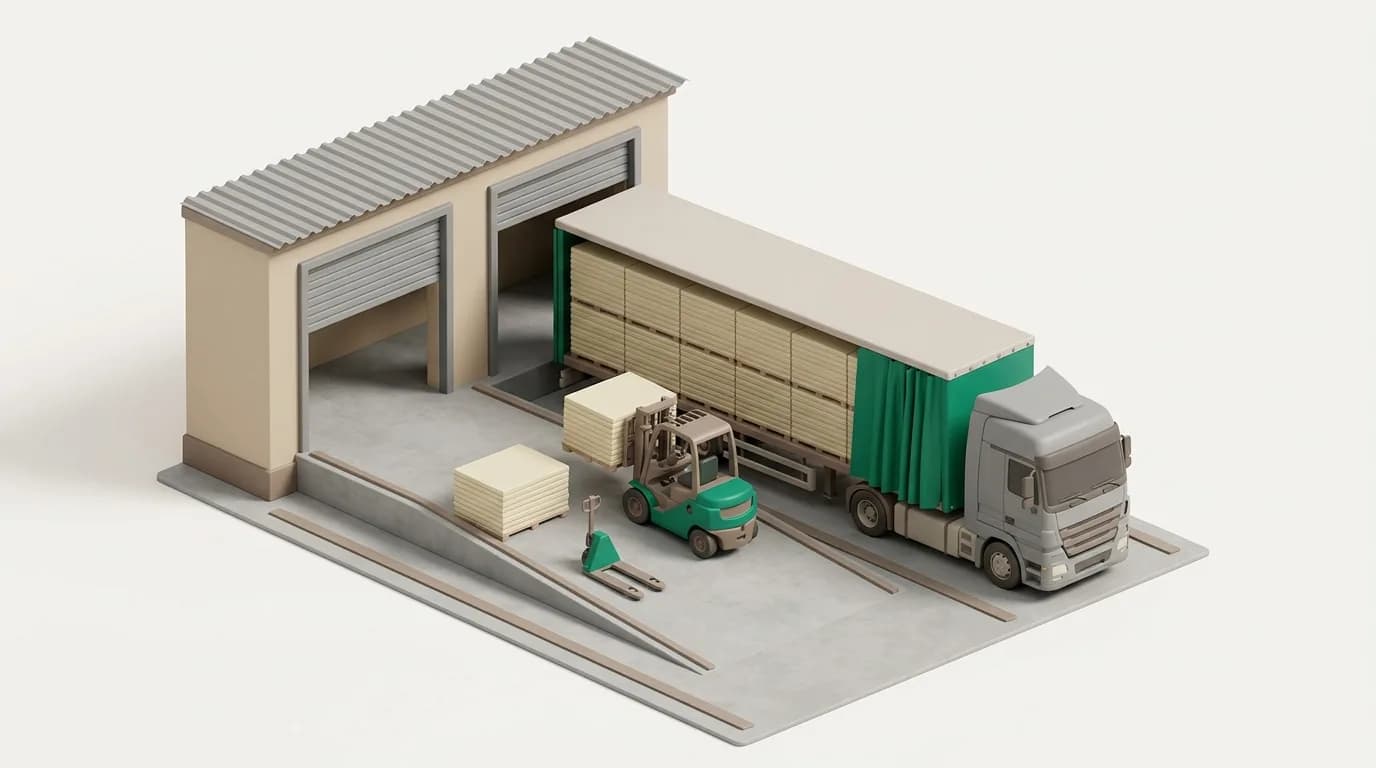
tkm factors are mass-based and assume the lorry's tonnage capacity is used. Light products fill the lorry's volume long before its tonnage: a 90 m³ trailer carries 1.8 tonnes of EPS at 20 kg/m³, whereas its tonnage capacity is around 24 tonnes. The same fuel is divided over ten times less mass; the emission per tonne rises by up to a factor of ten. This is why EN 15804 requires the 'volume capacity utilisation factor' and 'bulk density' parameters to be declared. The correct calculation builds a utilisation rate on volume rather than mass: volume carried / trailer volume. In an insulation EPD without this correction A4 is a small fraction of reality, and in a building LCA it systematically favours low-density products.
The A4 scenario table in EN 15804
Where A4 is declared, EN 15804+A2 requires the scenario to be transparent enough for the building LCA to recalculate it. The table contains the following parameters:
- Vehicle type and fuel: for example 16–32 t lorry, diesel, EURO6; where there are several legs (factory → depot → site), one row per leg
- Distance: typical delivery distance, preferably a weighted average from the last year's sales records
- Capacity utilisation: mass-based utilisation in per cent, stating explicitly whether the empty return is included
- Bulk density of the transported product (kg/m³), so the reader can see whether it is volume-limited
- Volume capacity utilisation factor: 1 = mass-limited; below 1 for volume-limited products, with justification
- Result: A4 emission per declared unit, a separate column for every indicator
Worked example and sensitivity
One tonne of precast concrete element, 300 km, 16–32 t EURO6 lorry, roughly 0.12 kg CO₂e/tkm: 1 t × 300 km × 0.12 = 36 kg CO₂e. If the element's A1–A3 is around 120 kg CO₂e/t, A4 is 30% of the product stage — not negligible. The same calculation for aggregate: A1–A3 is typically 3–8 kg CO₂e/t; a 50 km quarry-to-site distance gives 50 × 0.12 = 6 kg CO₂e/t, and A4 equals A1–A3. When the distance is uncertain, three scenarios are run — 100, 300 and 800 km — and the results reported side by side; at 800 km the precast element's A4 becomes 96 kg CO₂e/t and approaches the whole product stage. This sensitivity gives a numerical answer to the 'local or imported product' question: for a light, high-carbon product distance is irrelevant, for a heavy, low-carbon product distance decides.
Frequently asked questions
- How is A4 transport emission calculated in LCA?
- Gross transported mass (tonnes) is multiplied by distance (km) to give tonne-kilometres; that number is multiplied by the vehicle type's kg CO₂e/tkm factor. Example: 1 t of product, 300 km, 16–32 t lorry, roughly 0.12 kg CO₂e/tkm → 36 kg CO₂e. The factor is taken from a database such as ecoinvent and corrected for the product's utilisation and empty-return conditions.
- Which tkm emission factor should be used?
- The factor for the vehicle class actually used for delivery: in ecoinvent lorries are split into 3.5–7.5, 7.5–16, 16–32 and over 32 t classes, and further by EURO standard. When unknown, a 16–32 t EURO6 lorry is a typical assumption and gives roughly 0.12–0.17 kg CO₂e/tkm as an order of magnitude. Small vehicles are far higher per tonne, rail and ship far lower.
- How is the empty return included in the A4 calculation?
- For a product moved through a general distribution network the dataset's average utilisation already includes empty returns and the factor is used unchanged. If the product travels in a dedicated lorry that returns empty, average utilisation falls; the factor is scaled by the ratio of dataset utilisation to actual utilisation and declared in the scenario table as 'including empty return'.
- Why does A4 come out high for light products such as insulation?
- Because the lorry fills by volume before it fills by tonnage. A 90 m³ trailer carries 1.8 tonnes of EPS at 20 kg/m³; with a tonnage capacity of 24 tonnes the same fuel is divided over ten times less mass. EN 15804 therefore requires bulk density and the volume capacity utilisation factor to be declared; utilisation is calculated on volume rather than mass.
- What distance should be assumed for A4?
- The best source is the tonnage-weighted average of delivery distances from the last year's sales records. Some PCRs and programme operators provide default distances; if one is used, it is stated in the scenario table. In the building LCA this value is replaced with the project's actual distance. Where uncertainty remains, 100/300/800 km scenarios are reported side by side.
Tags
- A4 transport
- tonne-kilometre
- load factor
- life cycle assessment
- EN 15804
- scenario analysis
- ecoinvent
Related reading
All articles in Data & Methods- Data & Methods
Scenario analysis: how end-of-life assumptions decide the result
Nobody knows what recycling infrastructure will look like in fifty years. How to work with that uncertainty and report scenarios honestly.
10 min read - Data & Methods
Embodied carbon calculation at product and element scale: A1–A3
A product's embodied carbon is the sum of its A1–A3 emissions per declared unit. The formula, the A1/A2/A3 split, pulling values from EPDs, the biogenic carbon distinction and a worked example for 1 m² of wall.
11 min read - Data & Methods
Primary and secondary data: which to collect for which line
Modelling everything with primary data is neither possible nor necessary. The foreground-background split and allocating a data collection budget well.
10 min read - Data & Methods
Energy recovery or material recycling? Comparing the credits
The same tonne of plastic displaces electricity if burned and granulate if recycled — but the two credits are not the same size and cannot both be granted to one stream. The waste hierarchy, EN 15804 Table 13 and the formulae.
11 min read