Embodied carbon calculation at product and element scale: A1–A3
A product's embodied carbon is the sum of its A1–A3 emissions per declared unit. The formula, the A1/A2/A3 split, pulling values from EPDs, the biogenic carbon distinction and a worked example for 1 m² of wall.
By clca Editorial TeamLast updated
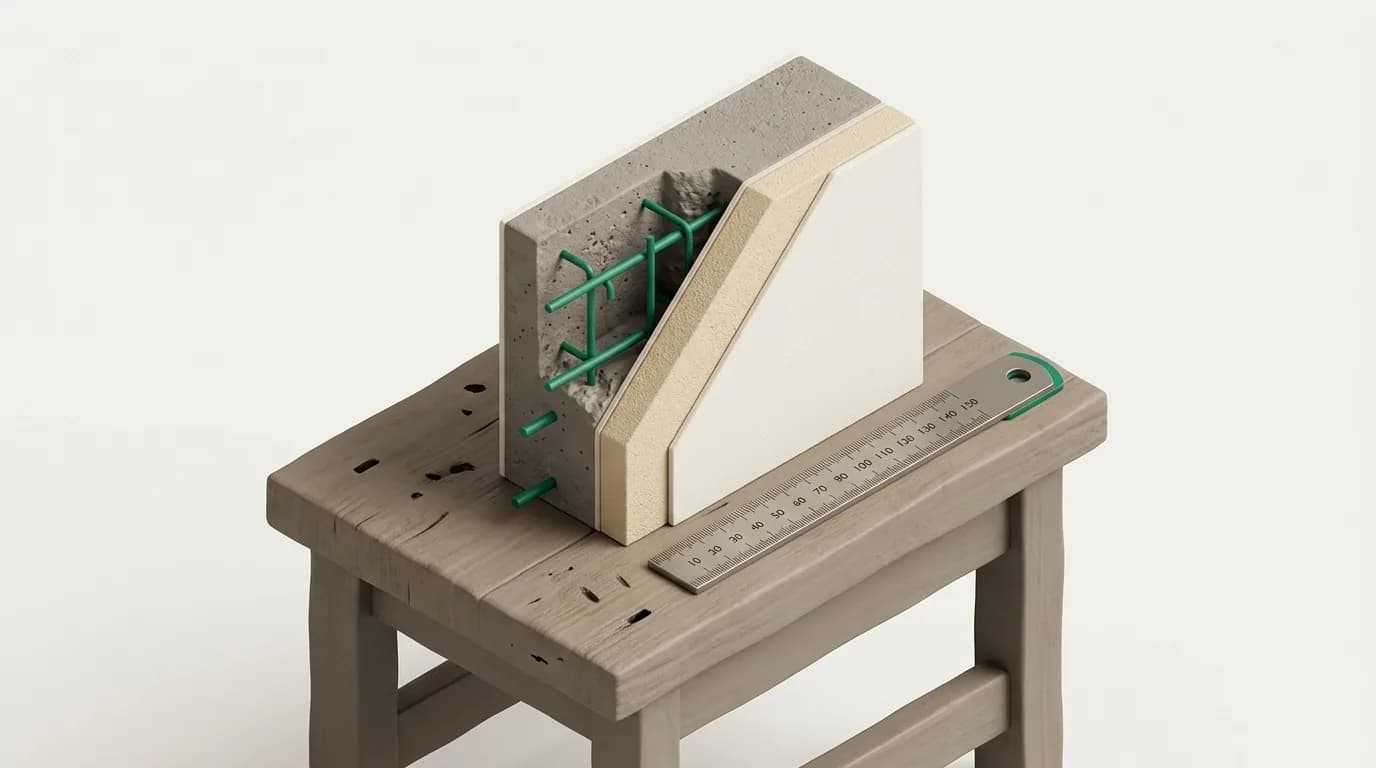
A product's embodied carbon is the sum, in kg CO₂e, of the greenhouse gases emitted for one declared unit of that product from raw material extraction to the factory gate (A1–A3); at element scale the total is found by multiplying each product in the element by its quantity and adding up. The principle is a single line: embodied carbon = Σ(quantity × emission factor). The difficulty lies not in the formula but in three places — the unit in which the quantity is measured, where the factor comes from and what scope it carries, and how biogenic carbon is counted. The article on embodied carbon at building scale explains how to read the total; this one shows how the total is built, step by step, at product and element level.
From building scale to product scale: same concept, different denominator
At building scale embodied carbon is given per square metre of gross internal area and covers modules A1–A5, B4 and C. At product scale the denominator is the declared unit — one tonne of cement, one cubic metre of concrete, one square metre of plasterboard — and the core scope is A1–A3, because the manufacturer controls nothing beyond the factory gate. Element scale sits between the two: one square metre of external wall, one metre of beam, one window. The element calculation is the bridge from product values to the building calculation, multiplying product values by geometry. Moving between the three scales has one rule: write the denominator and the module scope explicitly on every line. 'kg CO₂e' on its own is meaningless; 'kg CO₂e / m³, A1–A3' means something.
The basic formula: Σ(quantity × emission factor), module by module
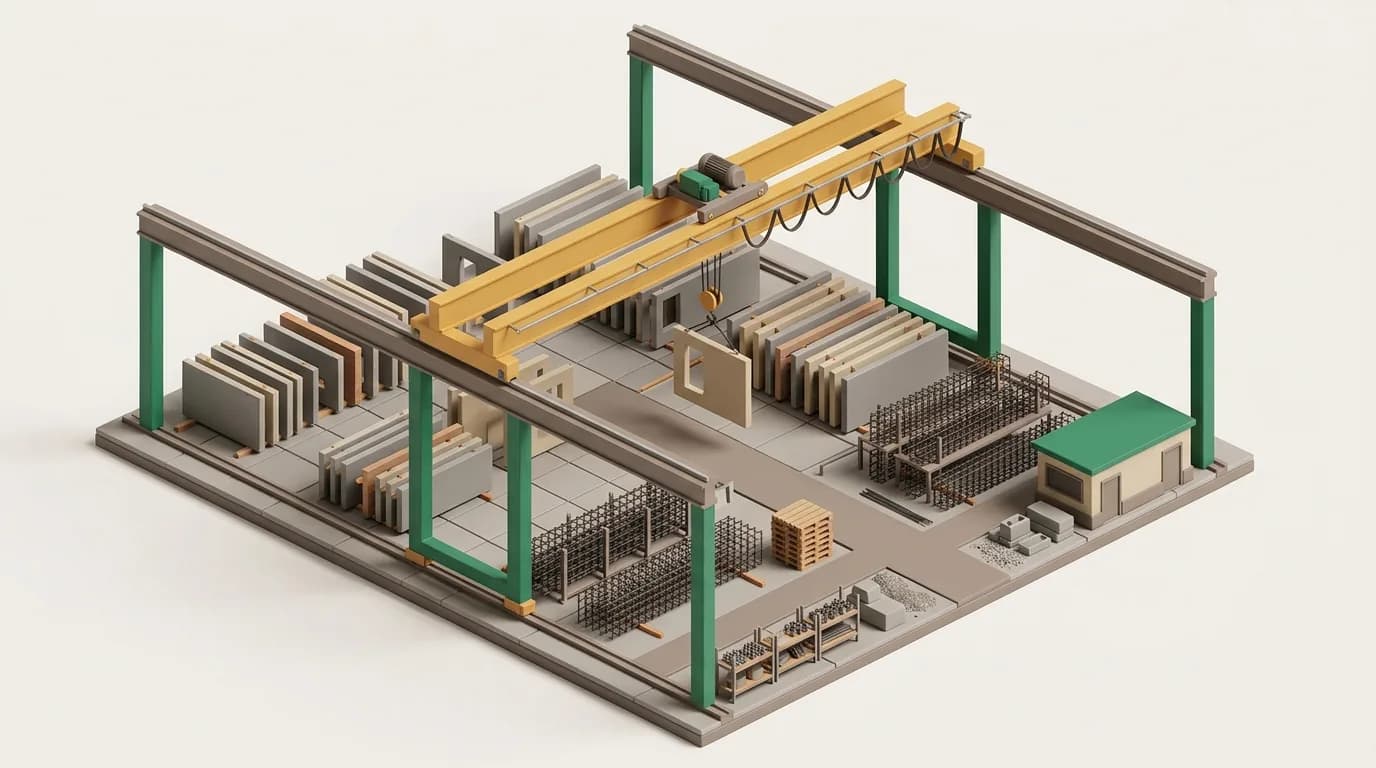
At product level the calculation is, for every inventory row, the product of quantity and emission factor, with the products summed module by module. For one tonne of cement the inventory rows are clinker, gypsum, grinding electricity, coal or petcoke, transport and packaging; each row's quantity comes from plant data and its factor either from a supplier EPD or from a background database such as ecoinvent. The result falls into three columns: A1 (production of raw materials), A2 (transport of raw materials to the factory), A3 (manufacturing at the factory). The sum of the three is 'cradle-to-gate' embodied carbon. A common mistake is to limit A1 to direct inputs under the label 'raw materials'; A1 includes the whole upstream chain — the inputs' own production chains. The factor already carries that; if it does not, it is the wrong factor.
Separating A1, A2 and A3
The split is not just for reporting; it shows where the abatement lever is. When A1 dominates (typically 70–90% of the total for products containing cement, steel or aluminium), the lever is supplier selection and material substitution. When A3 dominates (in kiln-intensive products such as ceramics, glass or lime), the lever is the plant's fuel and energy efficiency. A2 rarely exceeds 10%; when it does, raw materials are travelling far and the logistics deserve a second look. Two rules govern the split: A3 includes the process emissions arising during manufacturing (calcination, anode consumption in electrolysis) separately from fuel emissions; and packaging production goes into A3 while packaging waste treatment goes into A5 — if A5 is not declared at product scale, packaging waste does not stay in A3, it is merely noted.
Pulling values from an EPD: declared-unit conversion
In an element calculation most factors come from EPDs, and every EPD uses its own declared unit: concrete in m³, reinforcement in kg or t, insulation in m² × R-value or in m³, bricks per piece or per m² of wall. Getting to the element takes three conversions. First geometry: 200 mm thickness × 1 m² = 0.2 m³. Second density: 0.2 m³ × 2,400 kg/m³ = 480 kg. Third the EPD's own conversion table — insulation EPDs state 'the thickness needed for R = 1 m²K/W' and the required thickness is reached by proportion. At each step the unit is converted until it matches the EPD's unit; if the EPD declares per kg, mass is derived; if per m², area. Wastage is added too: the portion cut and discarded on site (typically 2–10%) increases the quantity entering the element and is counted separately in A5; at product scale the net quantity without wastage is used.
Biogenic carbon and the GWP-fossil distinction
EN 15804+A2 splits GWP-total into three components: GWP-fossil, GWP-biogenic and GWP-luluc. A product containing timber, cellulose or a bio-based polymer can show a negative A1–A3 GWP-total, because stored biogenic carbon is entered as −1 and the +1 release happens at end of life (C3/C4). In an element calculation that compares only A1–A3, this makes timber look better than it is; set beside steel or concrete the comparison is not fair. There are two safe routes: compare on GWP-fossil, or bring the C modules into scope for all products. The embodied carbon report states which route it took and declares the biogenic carbon content separately in kg C, so the reader sees that a negative A1–A3 value is temporary storage rather than a permanent 'saving'.
Worked example: 1 m² of external wall
The A1–A3 embodied carbon of an external wall made of a 200 mm reinforced concrete shear wall and 100 mm of EPS insulation is built from three rows. The factors below are typical ranges seen in European EPDs and in ecoinvent 3.12 cut-off data; they vary by plant and grid, and in a real calculation the product's own EPD value takes their place.
- Concrete C25/30, 200 mm: 0.2 m³ × 250–300 kg CO₂e/m³ (CEM I-based mix) = 50–60 kg CO₂e
- Reinforcing steel, 80 kg/m³: 0.2 m³ × 80 = 16 kg × 0.8–2.0 kg CO₂e/kg (EAF from scrap at the low end, BF-BOF at the high end) = 13–32 kg CO₂e
- EPS, 100 mm, 20 kg/m³: 0.1 m³ × 20 = 2 kg × 3–4 kg CO₂e/kg = 6–8 kg CO₂e
- Total A1–A3: roughly 70–100 kg CO₂e per m² of wall; the reinforcement route (EAF or BF-BOF) alone makes a 20 kg difference
- The same wall with 100 mm of stone wool: 0.1 m³ × 100 kg/m³ = 10 kg × 1.2–1.6 kg CO₂e/kg = 12–16 kg; the insulation share doubles but the overall ranking does not change
The example shows three things. First, although the concrete's volume looks small, it carries more than half of the wall's embodied carbon; second, the reinforcement's production route makes a bigger difference than the choice of insulation; third, the width of the ranges explains why product-specific EPDs are needed — an element report calculated on 'typical values' cannot see the real difference between two suppliers.
Data quality and uncertainty
The factor-source hierarchy is clear: a product-specific, verified EPD at the top; a manufacturer or industry-average EPD second; an activity from a background database such as ecoinvent, selected with the right geography, third; national generic factor tables at the bottom. The source and scope of every row (A1–A3 or A1–A5, which version of the standard) is written down; values from the +A1 and +A2 versions are not mixed, because the characterisation factors differ. Uncertainty is measured row by row with pedigree scoring (reliability, completeness, time, geography, technology) and converted with Monte Carlo into a P10–P90 range for the total. At element level that range is usually ±15–25%; if the difference between two design options lies inside it, the result is reported as 'equivalent', not as 'better'.
Frequently asked questions
- How is embodied carbon calculated?
- For the product's declared unit, quantity is multiplied by emission factor on every inventory row and the products are summed in modules A1 (raw materials), A2 (transport) and A3 (manufacturing). At element scale each product's A1–A3 value is converted with geometry and density into the quantity in the element and summed. Factors come from a product-specific EPD or, failing that, from a background database such as ecoinvent.
- Are embodied carbon and product carbon footprint the same thing?
- No. Embodied carbon is the construction sector's term and covers the product's material-related emissions (A1–A3, and where relevant A4–A5, B4 and C); the operational energy of the use stage (B6) is excluded. A product carbon footprint (ISO 14067) aggregates the whole life cycle including use into one number. For construction products the two give the same figure for A1–A3.
- How much of total embodied carbon is A1–A3?
- For mineral and metal construction products A1–A3 typically makes up 80–95% of whole-life embodied carbon excluding D; modules A4 and C share the rest. For products replaced several times over the building's life (finishes, membranes) the B4 share grows and the A1–A3 proportion falls. That is why the element calculation also records the product's reference service life.
- How do I convert an EPD value to an element?
- First read the EPD's declared unit (m³, kg, m² × R-value). Then convert the quantity in the element to that unit using geometry (thickness × area), density where needed (m³ → kg) and the EPD's own conversion table (R-value → thickness). Add site wastage to the element and count it separately in A5. Never multiply before the units match.
- Can biogenic carbon make embodied carbon negative?
- For A1–A3, yes: because EN 15804+A2 enters stored biogenic carbon as −1, timber products can show a negative GWP-total at the factory gate; the +1 release occurs in C3/C4. For a fair comparison either GWP-fossil is used or the C modules are brought into scope for all products. Biogenic carbon content is declared separately in kg C.
Tags
- embodied carbon
- life cycle assessment
- A1-A3 modules
- GWP-fossil
- declared unit
- construction product EPD
- emission factor
Related reading
All articles in Data & Methods- Data & Methods
Transport in LCA (A4): tkm, load factor and empty return
A4 is the transport of the product from factory gate to site, calculated as mass × distance × a per-tkm factor. Vehicle class, utilisation, empty return and the trap of volume-limited products; the EN 15804 scenario table and a worked example.
11 min read - Green Building
What is embodied carbon? Definition, boundaries and benchmarks at building scale
As operational carbon falls, embodied carbon has become the dominant share. Which modules count, and which benchmarks apply?
11 min read - Data & Methods
Energy recovery or material recycling? Comparing the credits
The same tonne of plastic displaces electricity if burned and granulate if recycled — but the two credits are not the same size and cannot both be granted to one stream. The waste hierarchy, EN 15804 Table 13 and the formulae.
11 min read - Data & Methods
Reference service life and replacement schedule: B4 cost in LCC
Service life is the parameter that moves an LCC result most after the discount rate. Where RSL comes from, the replacement formula N = ceil(T/SL) − 1, residual value, the B2/B3/B4 distinction and how long-lived products get unfairly penalised.
9 min read