A guide to the EN 15804 result tables: how to read Tables 8, 9, 11, 12, 13
The numerical core of an EPD is five result tables: core impact, additional impact, resource use, waste and output flows. What they mean, row by row.
By clca Editorial TeamLast updated
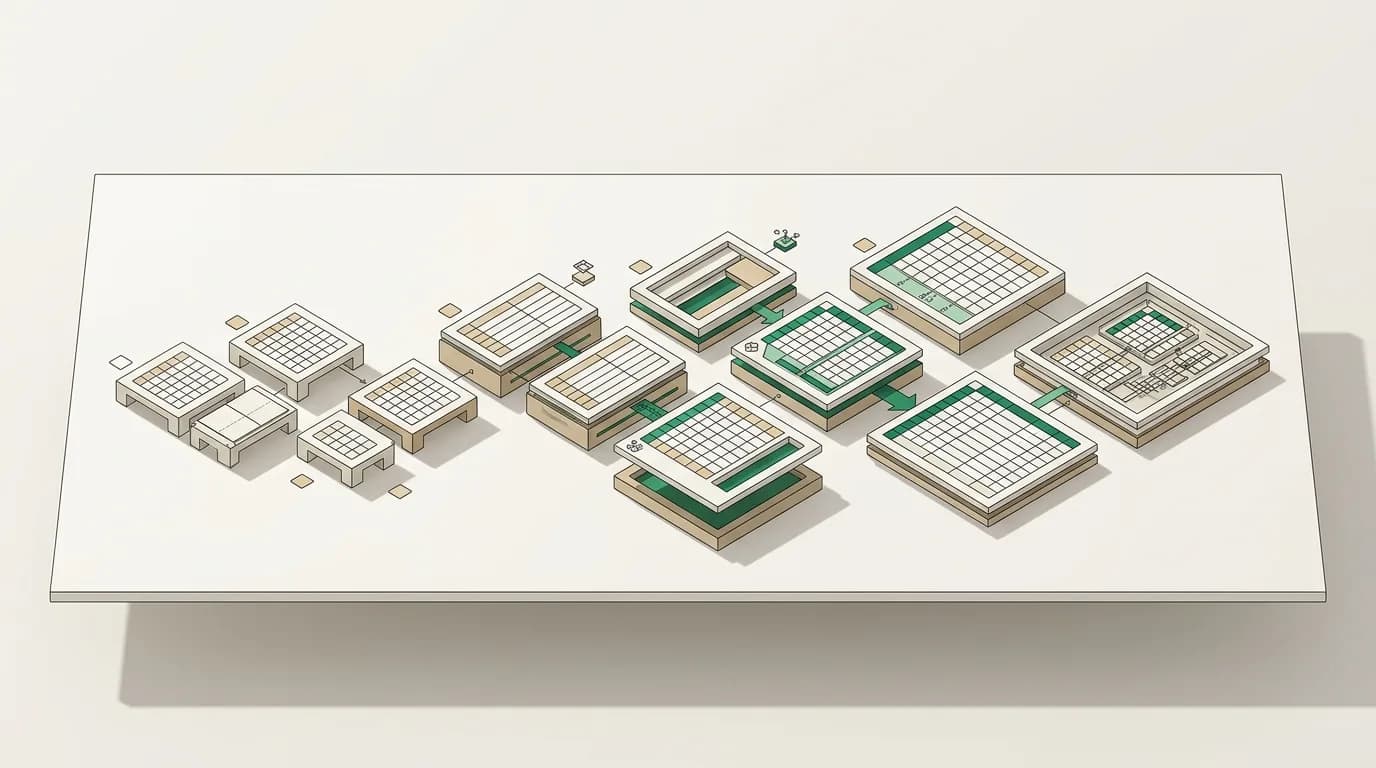
The numerical core of an EN 15804+A2 EPD is five result tables. Each shares the same skeleton: indicators as rows, life cycle modules (A1-A3, A4, A5, B1-B7, C1-C4, D) as columns. The verifier looks at these tables first; the architect or certification consultant pulls data from them into the building calculation. Reading them correctly is the precondition for using the EPD correctly.
Table 8 — core environmental impact indicators
The 13 mandatory indicators: GWP-total and its three components (GWP-fossil, GWP-biogenic, GWP-luluc), ODP (ozone depletion), AP (acidification), three eutrophication indicators (EP-freshwater, EP-marine, EP-terrestrial), POCP (photochemical ozone), ADP-minerals&metals, ADP-fossil and WDP (water use). All computed with EF v3.1 characterisation factors. The most common reading mistake: confusing GWP-total with GWP-fossil — for products storing biogenic carbon the two diverge substantially.
Table 9 — additional environmental impact indicators
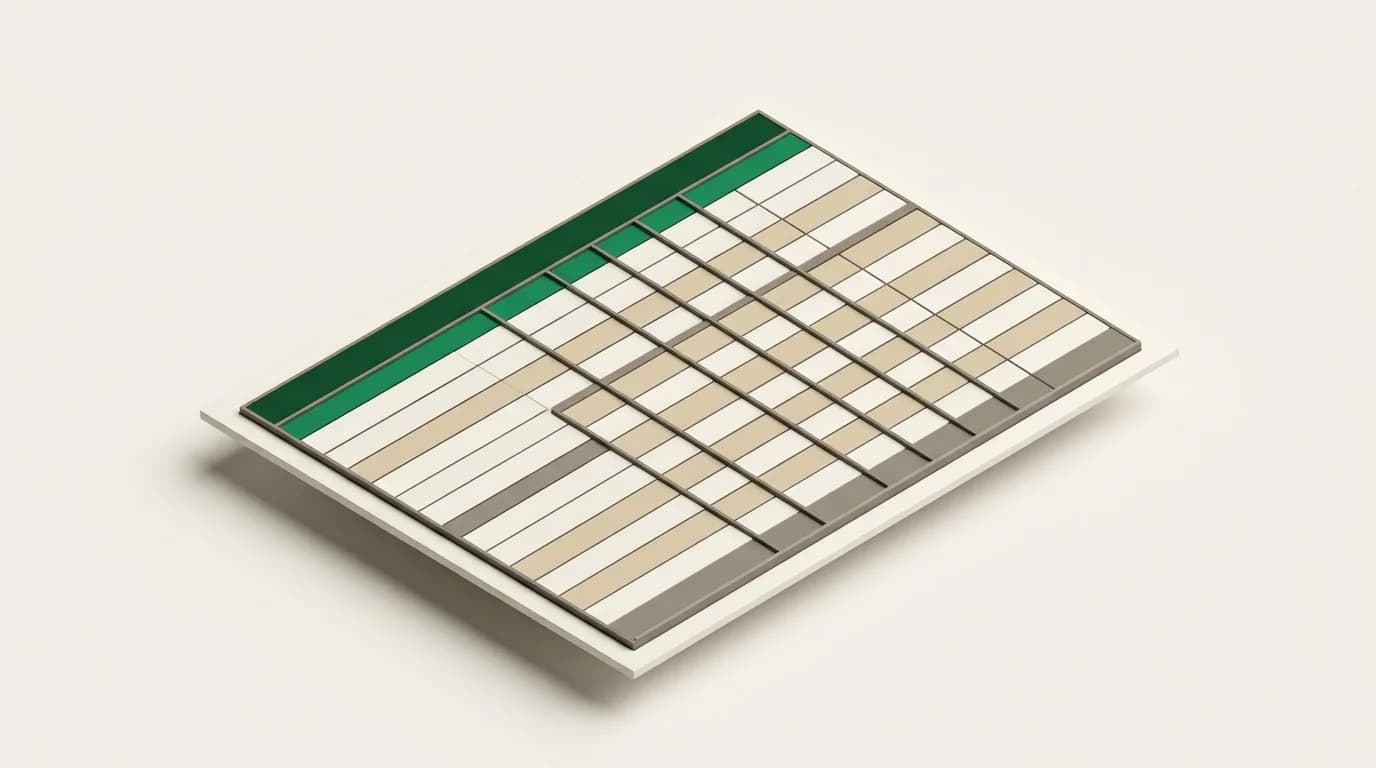
Particulate matter (PM), ionising radiation (IRP), ecotoxicity (ETP-fw), human toxicity (HTP-c carcinogenic, HTP-nc non-carcinogenic) and soil quality (SQP). These are mandatory to declare, but EN 15804+A2 adds an explicit caveat: toxicity results carry high uncertainty and are not recommended for comparison. The verifier checks that this disclaimer appears in the EPD.
Table 11 — resource use
Reports energy and material inputs: PERE/PERM/PERT (renewable primary energy: as energy / embedded in material / total), PENRE/PENRM/PENRT (the non-renewable counterparts), SM (secondary material), RSF/NRSF (secondary fuels) and FW (fresh water). The PERM and PENRM rows carry what most readers skip: energy stored inside the material — biomass energy in timber, fossil feedstock in plastics. Computed via the CED methodology, these rows also indicate energy-recovery potential at end of life.
Table 12 — waste categories
Three rows: HWD (hazardous waste), NHWD (non-hazardous waste), RWD (radioactive waste). The RWD row usually surprises — it comes from electricity mixes with nuclear shares and is not expected to be zero. A product made on the French grid shows visibly higher RWD than the Turkish grid; that is not an error but the mix's signature.
Table 13 — output flows
CRU (components for re-use), MFR (materials for recycling), MER (materials for energy recovery) and EE (exported energy). This table documents the mass bookkeeping of your end-of-life scenario in C3/C4 and the inputs to the module D calculation. If your MFR row is 0 while module D declares a recycling benefit, the verifier catches it in the first round.
- Columns in every table are limited to the selected modules; undeclared modules are marked "MND"
- GWP-total = GWP-fossil + GWP-biogenic + GWP-luluc — check the sum
- Table 9 toxicity indicators are not used for comparison (high-uncertainty caveat)
- Table 13 MFR/MER values form the mass basis of module D benefits
- Units change between tables: kg CO₂eq, MJ, kg, m³ — carry the unit when copying
Tags
- EN 15804 tables
- EPD result tables
- GWP-fossil
- resource use indicators
- waste categories
- output flows
Related reading
All articles in Platform- Platform
What is techno-economic analysis? Combining LCC with environmental LCA in one model
Life cycle costing (LCC) is the economic twin of environmental LCA. The ISO 15686-5 and EN 16627 framework, NPC/EAC indicators, and why costs never enter the EPD.
12 min read - Platform
Biogenic carbon and end-of-life scenarios: EN 15804 §7.4.4 in practice
The -1/+1 rule, per-material biogenic carbon declaration, and how reuse / recycling / energy-recovery scenarios play out in GWP-biogenic.
11 min read - Standards
What is EN 15804+A2? A practical guide for product manufacturers
EN 15804+A2 (2019) is the mandatory European EPD standard for construction products. This guide covers indicators, the modulary table, MNR/MND, verification and end-to-end production with clca.
14 min read - Platform
CAPEX/OPEX and EN 15804 modules: the two axes of cost + €/t CO2e marginal abatement cost
Every cost item is classified on two axes: EN 15804 module and cost nature. This dual axis underpins marginal abatement cost (€/t CO2e) and the cost-carbon quadrant plot.
11 min read