How is a product life cycle (LCA) calculated? In six steps
The whole flow from functional unit to result table. What data to collect, where to get it, and how quickly a first calculation can be finished.
By clca Editorial TeamLast updated
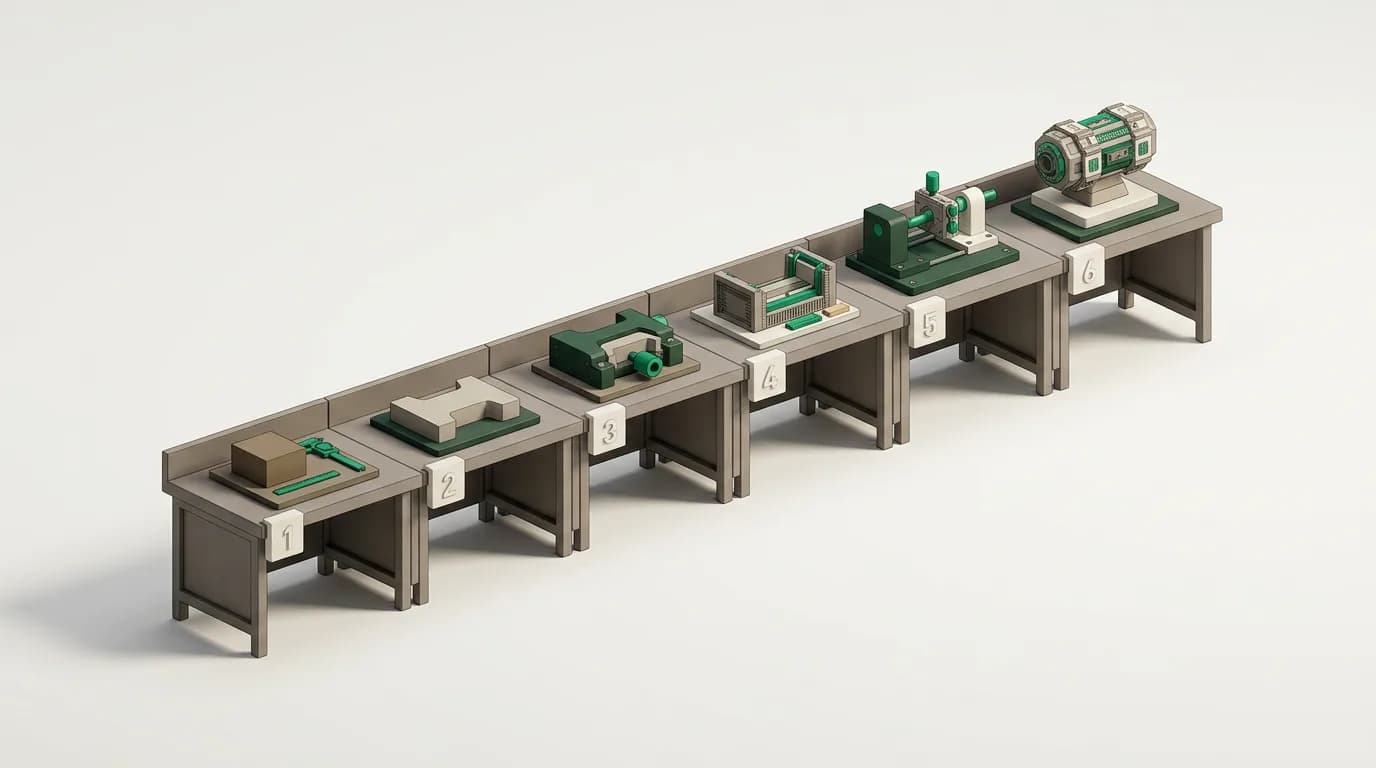
Calculating a product life cycle means carrying out a life cycle assessment (LCA) as described by ISO 14040 and ISO 14044. The arithmetic is not the hard part — flow quantities are multiplied by characterisation factors and summed. The hard part is deciding what to measure and finding the data.
Step 1 — Define the functional unit
Everything starts here, and if this is defined wrongly everything after it is invalid. LCA measures a function, not a product. ‘One litre of paint’ is a quantity; ‘protecting one m² of surface for ten years’ is a function. If you will compare two products you must show both deliver the same function at the same performance.
Step 2 — Draw the system boundary
Decide which stages are included: cradle-to-gate (A1-A3), cradle-to-grave (A1-C4), or a module selection. If you sell an intermediate product, up to the gate suffices; if you sell a final product, excluding use and end-of-life distorts what the number means.
In the same step, write down your cut-off rules: which flows you will omit and why. A cut-off decision is not an error; an undocumented cut-off is.
Step 3 — Collect the inventory
This step consumes most of the total effort. For processes under your control — your own site, your own recipe — you collect primary data.
- Recipe — raw material and additive quantities per product, including scrap rate
- Energy — the production line’s electricity and fuel consumption, split by product where possible
- Process emissions — emissions from chemical reactions, independent of fuel
- Water — withdrawn and consumed volumes, separately
- Waste — type, quantity and treatment destination
- Packaging — all packaging materials delivered with the product
- Transport — inbound raw materials and outbound product; distance and vehicle type
Step 4 — Match to background data
Every input you buy has its own production chain, and you do not model it yourself. Those chains come from a life cycle inventory database such as ecoinvent. The critical point is match accuracy: pick the activity closest to your actual supply in geography, technology and time.
If a supplier gives you a verified EPD for their own product, use it instead of the generic database record — this is the single intervention that most raises the quality of the result.
Step 5 — Run the impact assessment
Hundreds of inventory flows are multiplied by characterisation factors and become meaningful indicators: climate change in kg CO₂e, acidification in mol H⁺ equivalent, water use in scarcity-weighted m³. Which method set is used changes the result and must be stated in the report — if you are preparing an EPD, the EN 15804+A2 indicator set is mandatory.
Step 6 — Interpret
When the first result arrives, the thing to do is not report the number but look at the distribution. Which stage, which material does the impact concentrate in? Almost always a small share of the lines accounts for most of the total. Then run a sensitivity analysis: which assumption moves the result, and by how much?
Frequently asked questions
- How is a product life cycle LCA calculated, in short?
- In six steps: define the functional unit, draw the system boundary, collect the inventory, match to a background database, run the impact assessment, interpret the result. The calculation itself is multiplication and addition; most of the effort sits in steps three and four, on the data side.
- How long does calculating a product life cycle take?
- For a first product it typically ranges from a few weeks to a few months, and what determines the duration is data collection rather than modelling. Second and subsequent products at the same site are much faster, because the background model, energy data and supplier records already exist.
- Can it be done in a spreadsheet?
- For a simple product it is technically possible, but there are two problems. First, you cannot carry a background database’s thousands of processes by hand; second, a verifier wants to follow the path from source data to result, and formulas buried in cells make that hard. If you are aiming at an EPD you need a traceable model.
- Which data is strictly required?
- The minimum set: the recipe per product (raw material quantities), the production line’s energy consumption, process emissions, packaging and transport distances. Without these the calculation describes a sector average rather than your product.
Tags
- product life cycle
- LCA calculation
- functional unit
- life cycle inventory
- ecoinvent
- fundamentals
Related reading
All articles in Fundamentals- Fundamentals
What is a life cycle inventory (LCI)?
LCI is the phase where every flow in and out of the system is counted. An LCA’s quality is decided here — and so is most of its effort.
10 min read - Fundamentals
What is a product life cycle? The stages from cradle to grave
Every stage a product passes through from raw material to waste. What each stage covers, how they map to the EN 15804 modules, and where impact usually concentrates.
10 min read - Fundamentals
What is life cycle assessment (LCA)?
LCA is the standardised method for measuring a product’s environmental impact from raw material to waste. Its four phases, what it does and does not do, and where to start.
12 min read - Fundamentals
What is an emission factor? Where to find one and how to choose
The multiplier in every carbon calculation. The source you pick moves the result noticeably, and the wrong factor is the most common calculation error.
9 min read